Log File Analyser Configuration
User Guide
User-Agents
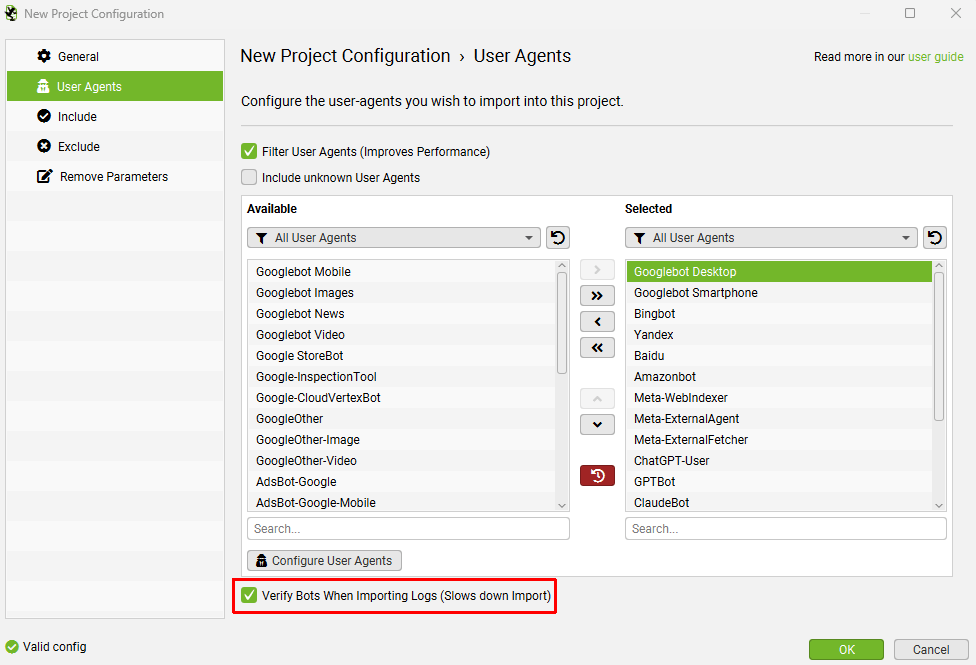
You’re able to configure the user-agents you wish to import into a project when creating a new project.
You can choose from the pre-defined list of common search engine and AI bot user-agents, or de-select those that are not relevant. This helps improve performance and reduces disk usage by focusing only on bots of interest.
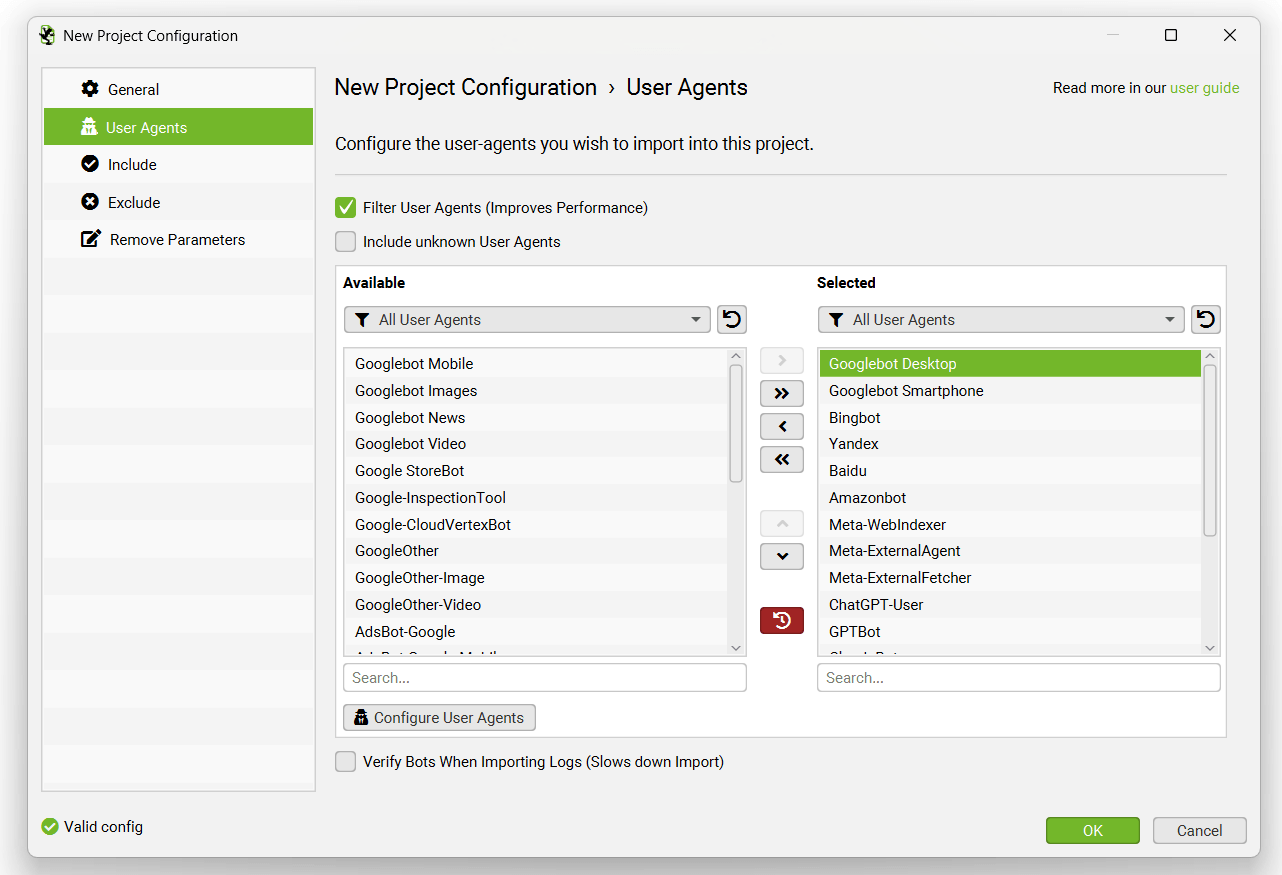
There are 3 settings that can be configured –
- Filter User Agents (Improves Performance) – This is enabled by default, so only the ‘selected’ user-agents are imported, rather than every user agent. This reduces the size of the import and improves speed of the analysis.
- Include Unknown User-Agents – This option is disabled by default. If enabled, any user agents that are not known (defined by the full ‘Available’ list of user agents) will be included in the analysis. This can be useful for analysing bots that are crawling your website, that are not browsers, or known search or AI bots that you may wish analyse further or block.
- Verify Bots – This will verify that search bots and AI bots that support verification will be verified as genuine, and not spoofed. This will make the initial log file import take longer, or alternatively you can perform this after importing.
The Log File Analyser will by default import data for the following search bot user-agents –
- All Googlebots – This includes Googlebot and Googlebot Smartphone.
- Googlebot
- Googlebot Smartphone
- Bingbot
- Yandex
- Baidu
However, you can choose to unselect or add additional user-agents to these.
The user-agent filter groupings make it easy to filter for the bots you wish to upload and analyse in projects.
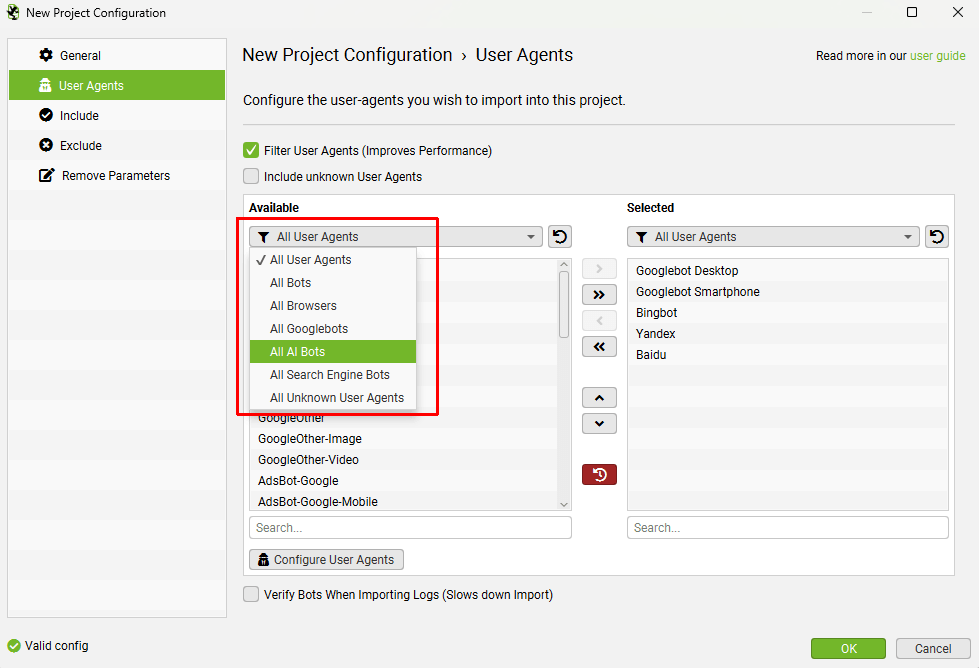
For example adding AI bots into the analysis.
Configure Custom User-Agents
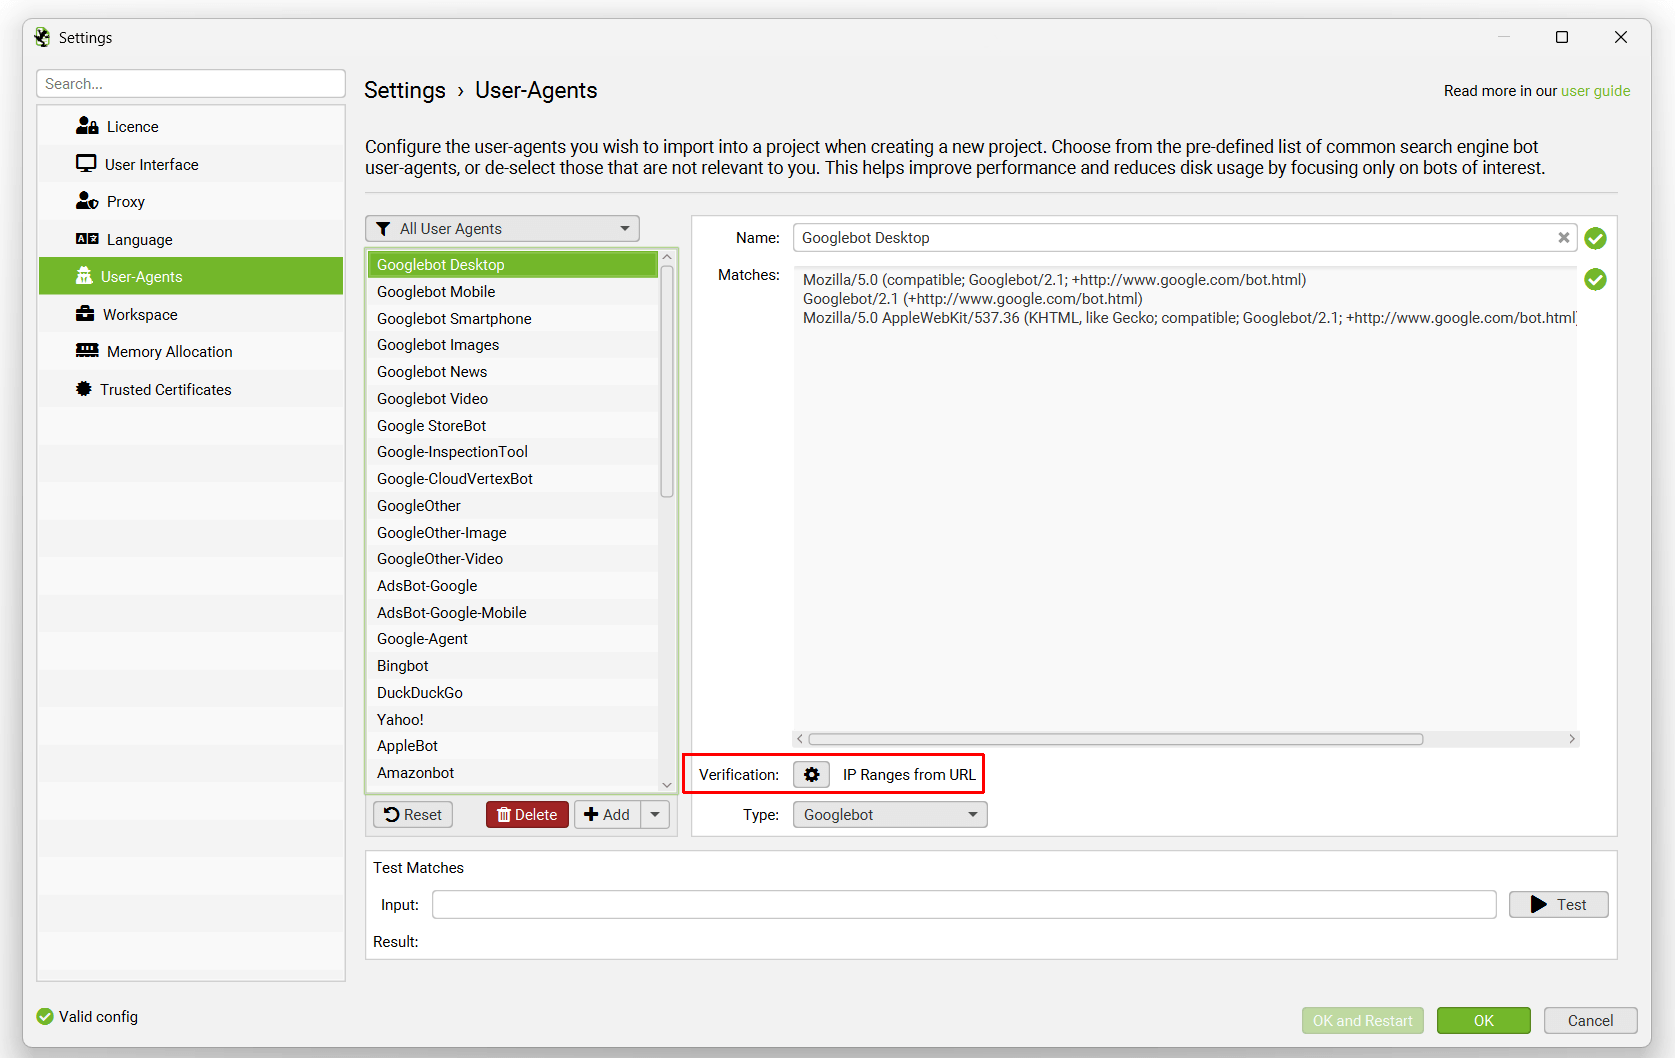
You can also add your own custom user-agents, which are then stored and can be selected for projects.
This can be configured via ‘Settings > User-agents’ or in a new project via ‘New > User Agents > Configure User Agents’.
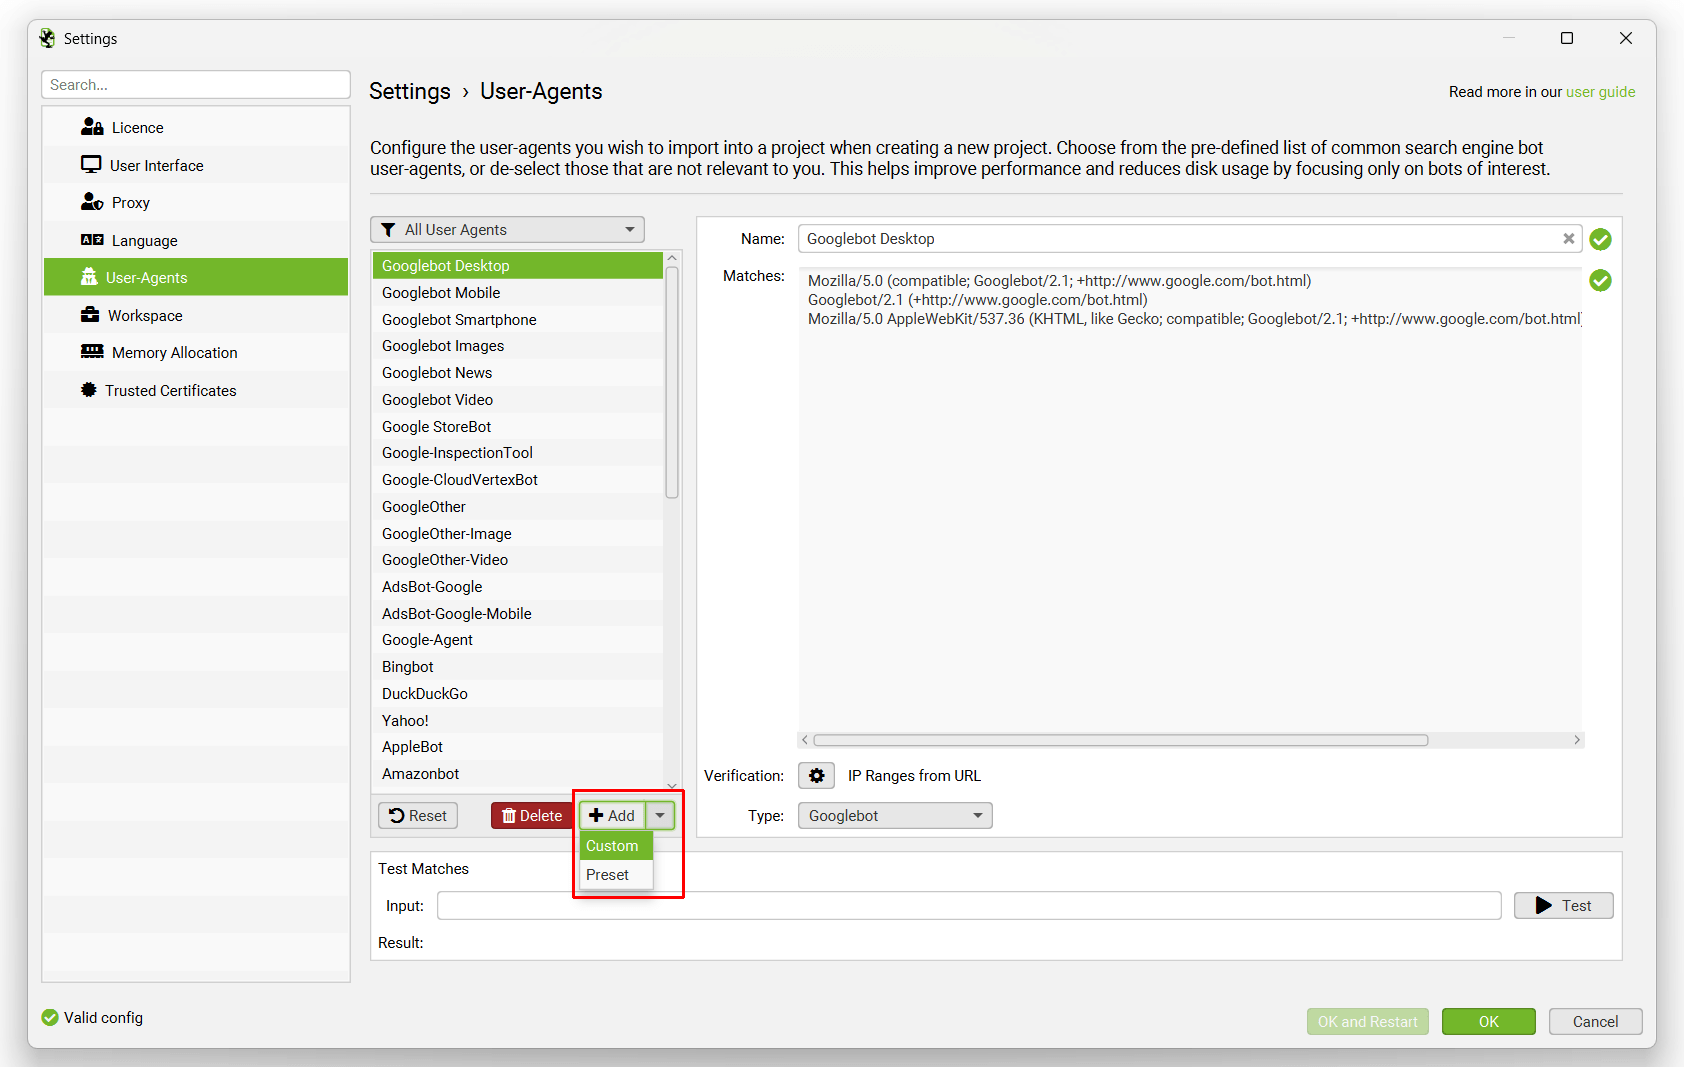
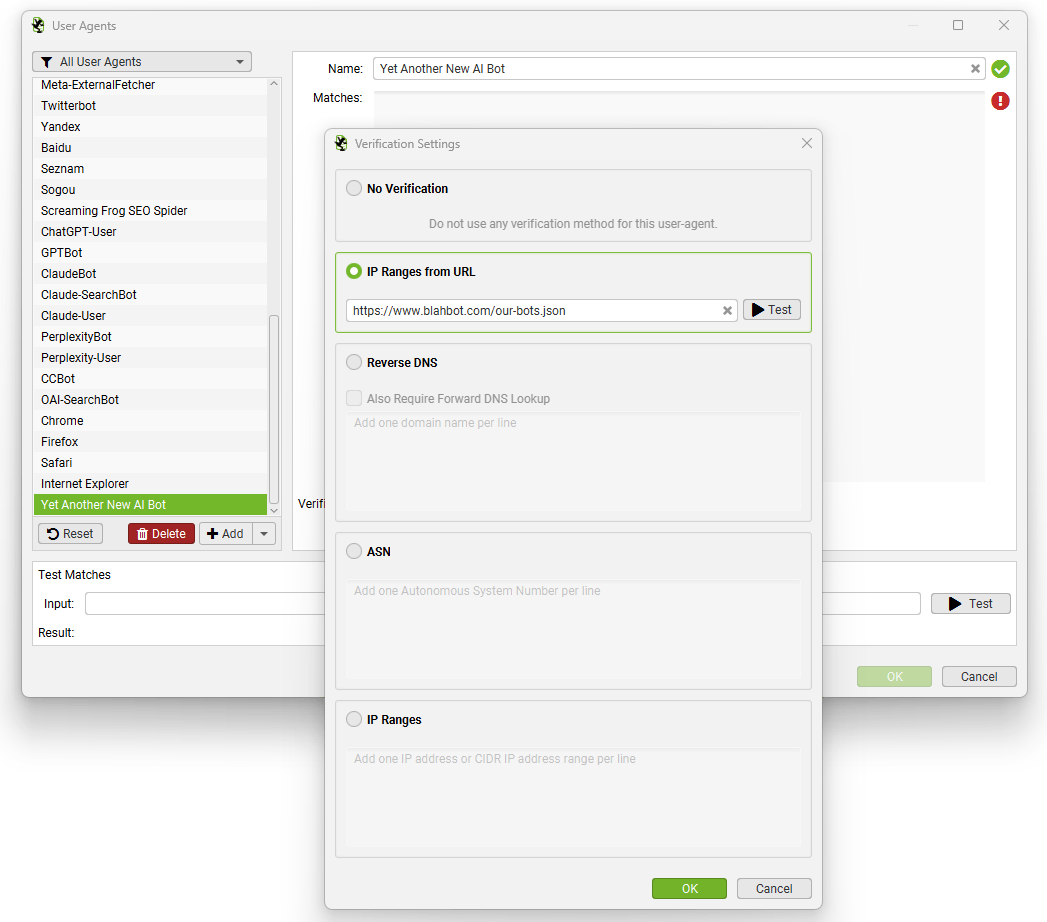
Each new user-agent can be assigned to a category (Bot, Browser, Search Engine Bot, AI Bot, Googlebot) and have verification set up.
When you add a new user agent, you’re able to configure bot verification. You can input IP ranges from a JSON URL, reverse DNS, ASN or static IP ranges to perform verification.
If bot verification changes for any existing user agents, you do not need to wait for our team to push an updated version of the Log File Analyser, you can just update immediately.
Verify Bots
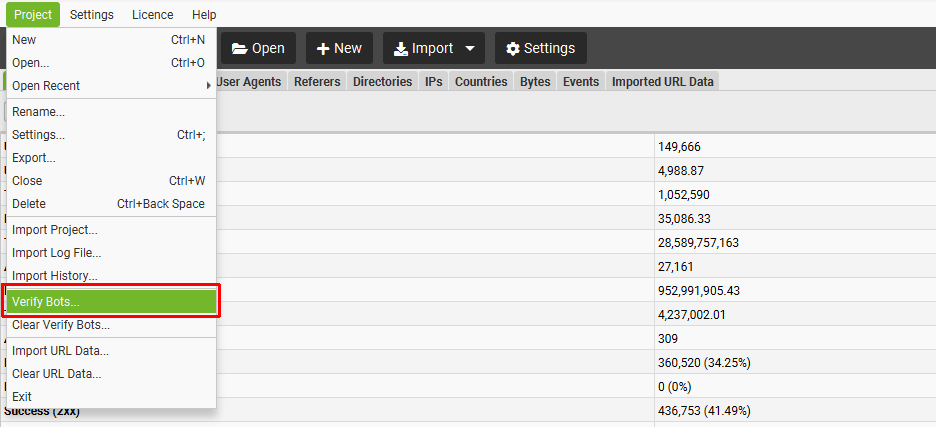
You can automatically verify search engine bots, either when uploading a log file or retrospectively after you have uploaded log files to a project.
When uploading logs, you’ll be given the opportunity to tick the ‘verify bots’ option under the ‘User Agents’ tab.
Search engine bots are often spoofed by other bots or crawlers, including our own SEO Spider software when emulating requests from specific search engine user-agents. Hence, when analysing logs, it’s important to know which events are genuine, and those that can be discounted.
If you have already imported log files, or would like to verify search engine bots retrospectively, then you can do so under the ‘Project > Verify Bots’ menu.
The Log File Analyser will verify all major search engine bots according to their individual guidelines. For Googlebot and Bingbot, the Log File Analyser will perform an extremely fast lookup against their publicly confirmed IP lists (Google IPs, Bing IPs) to confirm they are genuine.
For other bots such as Yandex and Baidu, the Log File Analyser will perform a reverse DNS and verify the matching domain name and then run a forward DNS using the host command to verify it’s the same original requesting IP. This takes significantly longer to verify, so remove these user-agents from your analysis if they are not required.
Bot verification will also be carried out on AI bots that support verification, such as GPTBot and Perplexity bot.
You can see the verification method for each user agent via ‘Settings > User Agents’ and looking at ‘Verification’.
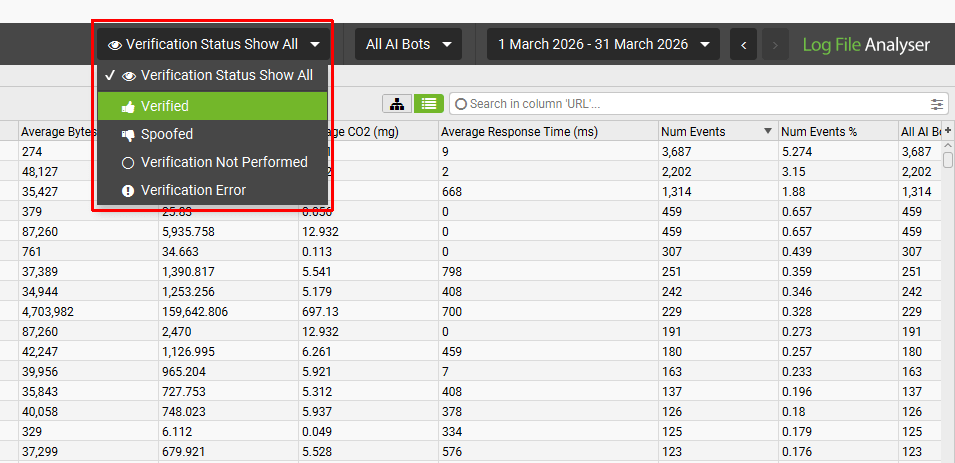
After validation, you can use the ‘verification status’ filter, to view log events that are verified, spoofed or if there are any errors in verification.
Troubleshooting
If you find all events being marked as Spoofed there are a few things to check:
- Is the Remote Host being read? Check the Remote Host value associated with the Events marked as spoofed. To do this click on one of the Events and look at the Remote Host value in the lower window pane. Remote Host is not mandatory, so if this was not available in the imported log file, it won’t be possible to verify the Event.
- The Remote Host has correct looking values: If the Remote Host values are all from a single, or small selection of IPs (Head over to the IP tab to see Unique IPs) then it’s likely these are from a load balancer such as Cloudflare, Sucuri etc. In this case hopefully the real IPs are in your log, they are just in another field that is not being picked up as the IP Address field. Try importing the logs again into a new project, this time choosing ‘Show log fields configuration window on each import’ when importing as shown here and seeing if there are any other fields that can be used for the IP. If the real IP is not available you will need to have the log format adjusted by the site administrator/hosting provider to include the real IP address. Before doing this you could double check that the real IP is not already in the log file. To do this, open up the log file in a text editor and inspect a few of the lines, is there more than 1 IP address on each line? If so please send the first few lines of the log or the Log File Analyser debug logs (Help->Debug->Save Logs) to our support team so we can make sure this isn’t a parsing issue.
- Verify Manually: For Googlebot the Log File Analyser verifies as Google recommends try this yourself, if you get different results please let us know. If not, go ahead and request the real IP is added to the log.
If you find any Events marked as “Verification Error”:
- Select to show “Verification Error” in the top level dropdown, the go to the Events tab, click on an Event and look at the “Verification Status” column. This will tell you why the “Verification Error” has occurred. “Invalid Bot IP” means the DNS lookup failed for the IP address of this event.
Include
This feature allows you to supply a list of regular expressions for URLs to import into a project. So if you only wanted to analyse certain domains, or paths, like the /blog/, or /products/ pages on a huge site, then you can now do that to save time and resource – and more granular analysis.
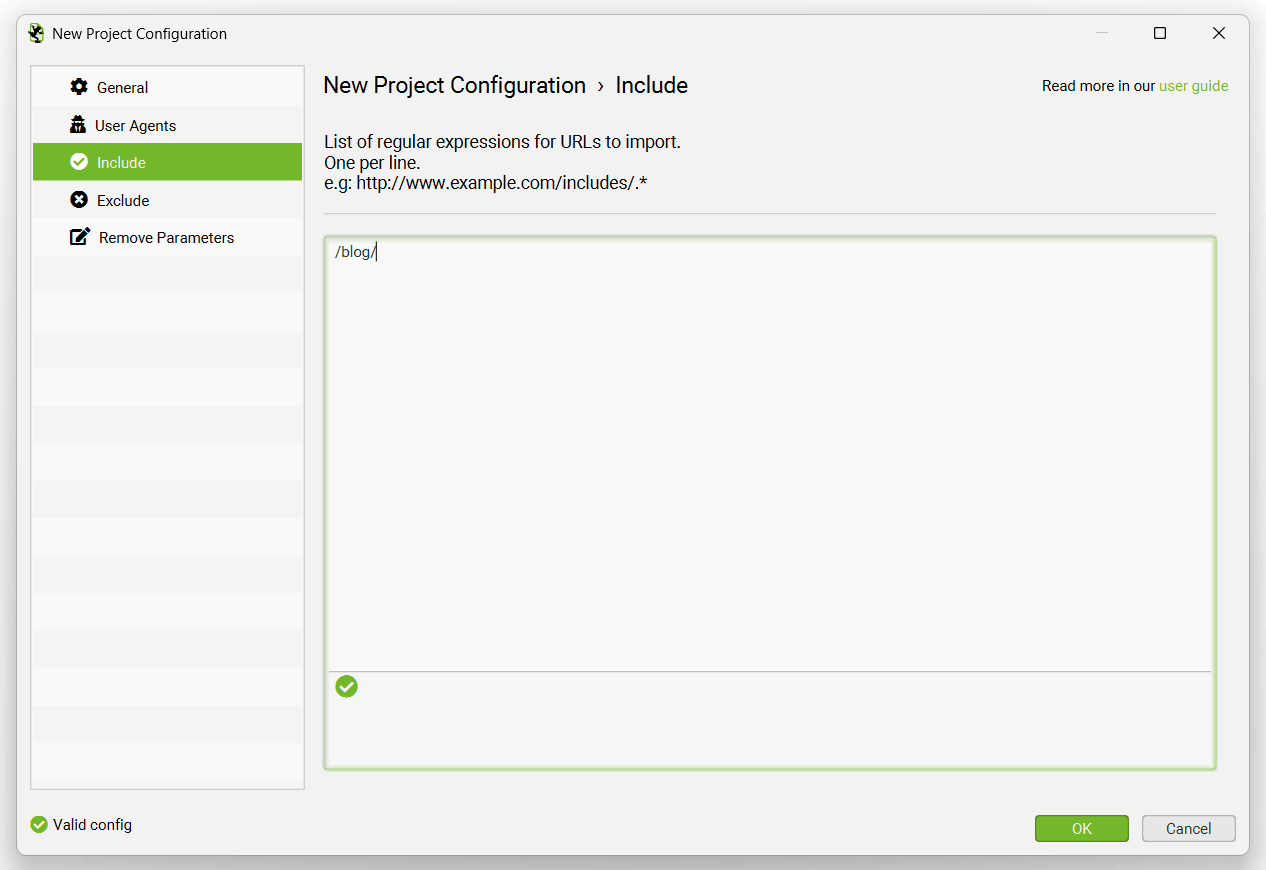
Only analysing certain paths will save time importing, analysing and disk space.
Exclude
This feature allows you to supply a list of regular expressions for URLs to exclude from being imported into a project. So if you wanted to exclude a section of the website such as a /forum/ or /blog/, then you can now do that to save time and resource – and more granular analysis.
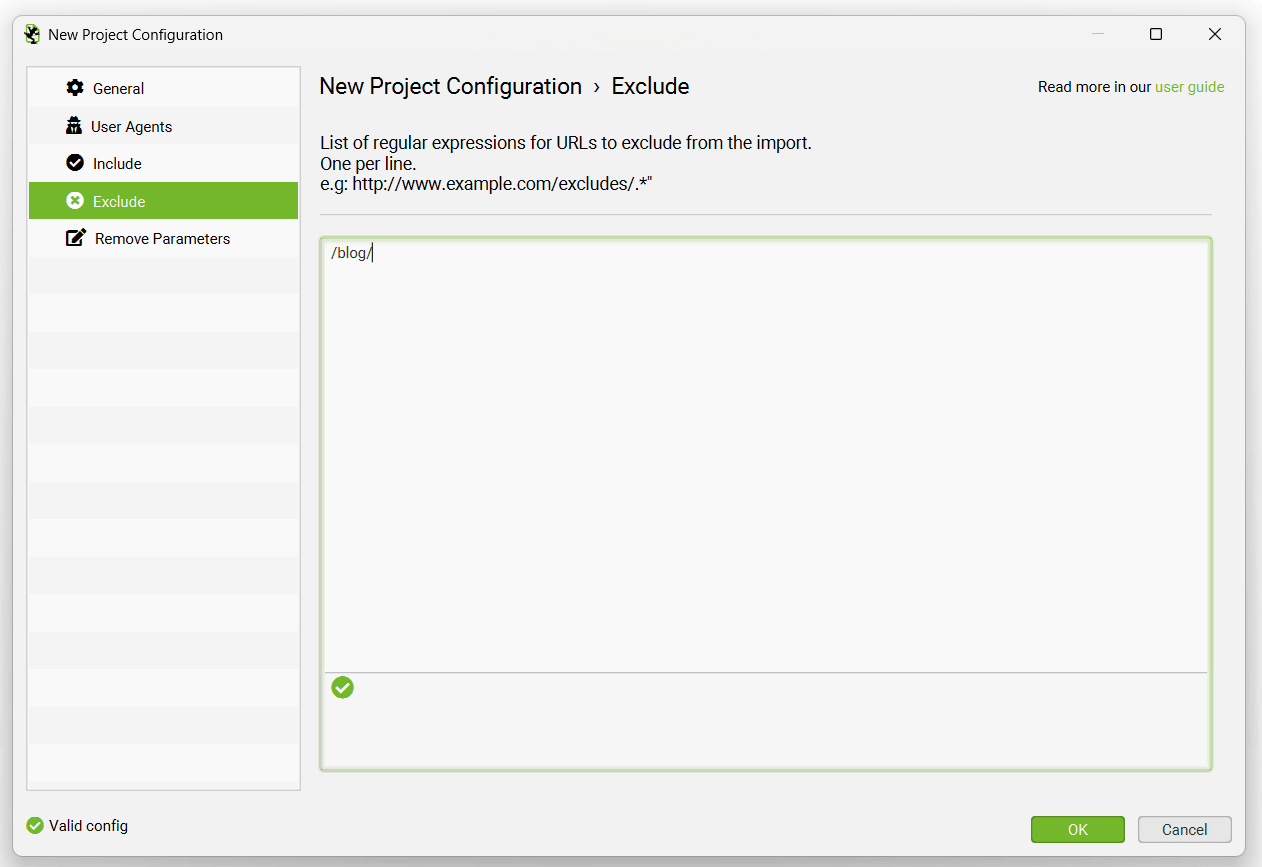
Excluding paths will save time importing, analysing and disk space.
Remove Parameters
This feature allows you to input a list of URL parameters to be stripped from URLs in the log file for analysis.
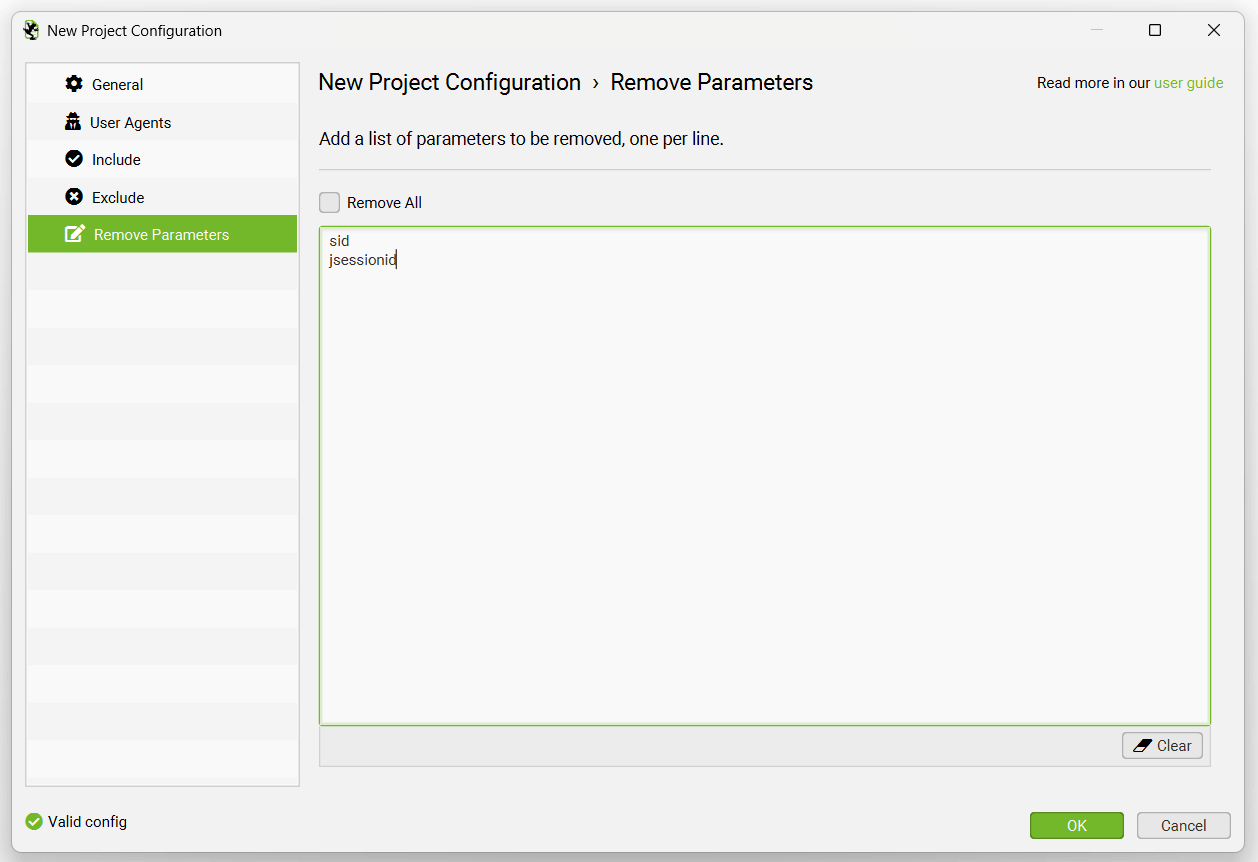
In the examples above, parameters such as ?sid=X and ?jsessionid=Y would be removed from the URL during import.
Date Range
In the top right hand side of the application, you can change the date range of your view across the project. There are 3 preset date ranges, the last day, the last 7 days or last 30 days, as well as an option for a custom date range.
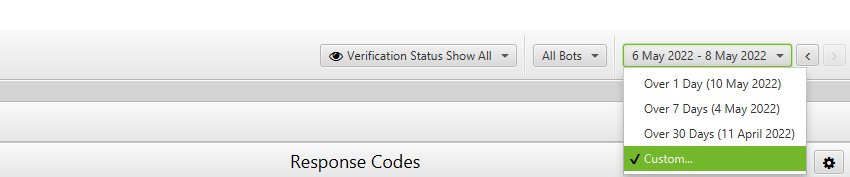
You can also skip backwards and forwards with dates using the arrows at the side. This will update the date range for all tabs, not just the tab you’re on.
Import History
You’re able to view the log file import history of a project by clicking on ‘Project > Import History’ via the top level menu.
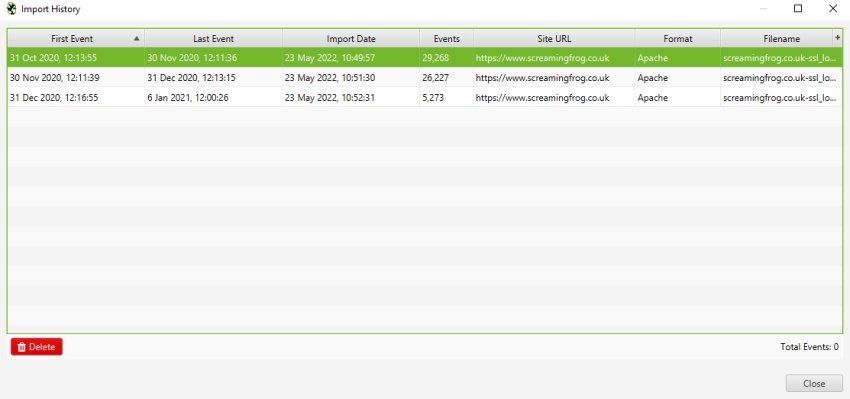
This allows you to view the first and last events from the log files, as well as the import date, number of events contained within the log file, site URL provided, log file format and the file name.
By clicking on the individual import rows, you can also delete import history, if you accidentally import incorrect logs.
Timezone
The Log File Analyser stores all events in Coordinated Universal Time (UTC). To view in your local timezone you can adjust the UTC offset to match your current timezone. You can select this either at project creation time:
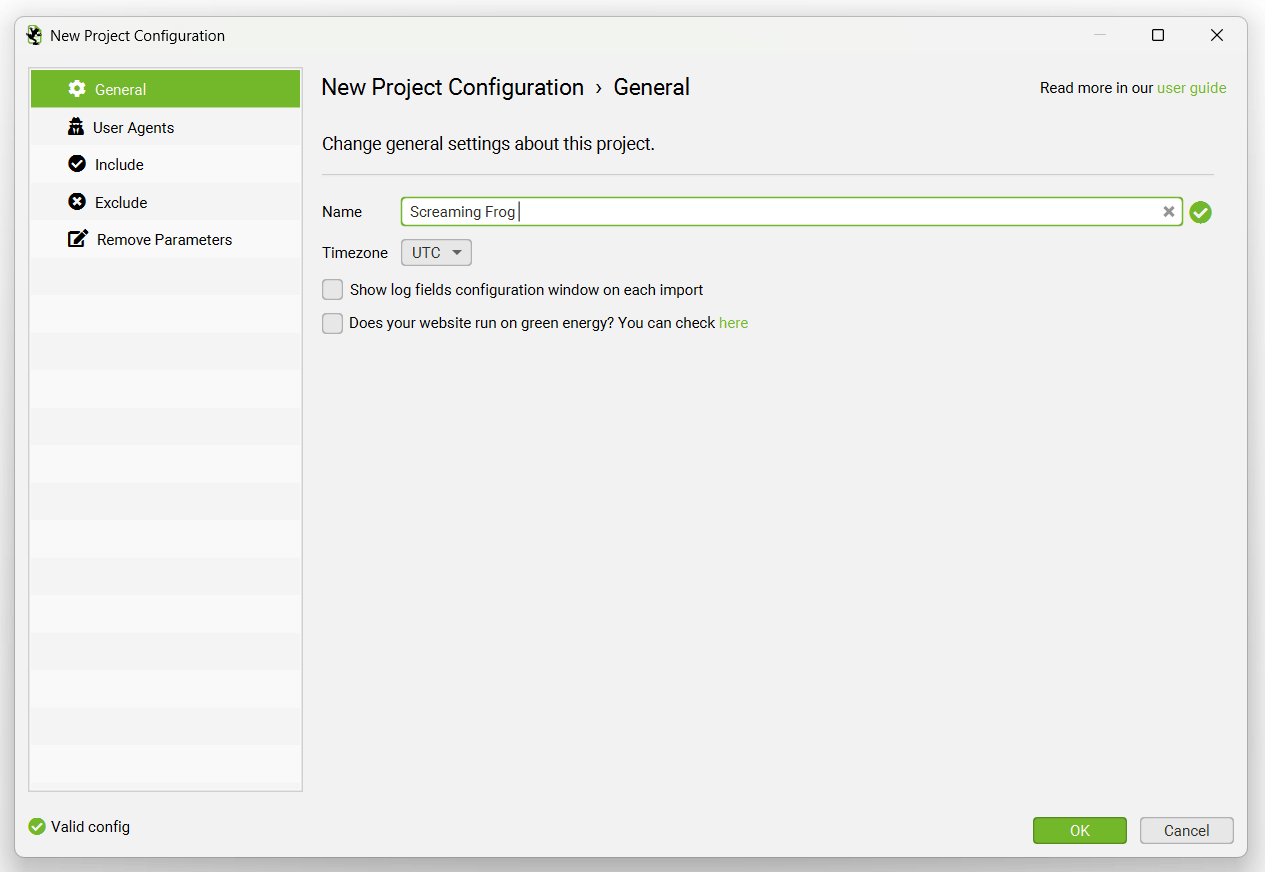
Or by going to the ‘Project > Settings > General’ and clicking on the ‘Timzone’ dropdown when you have a project open.
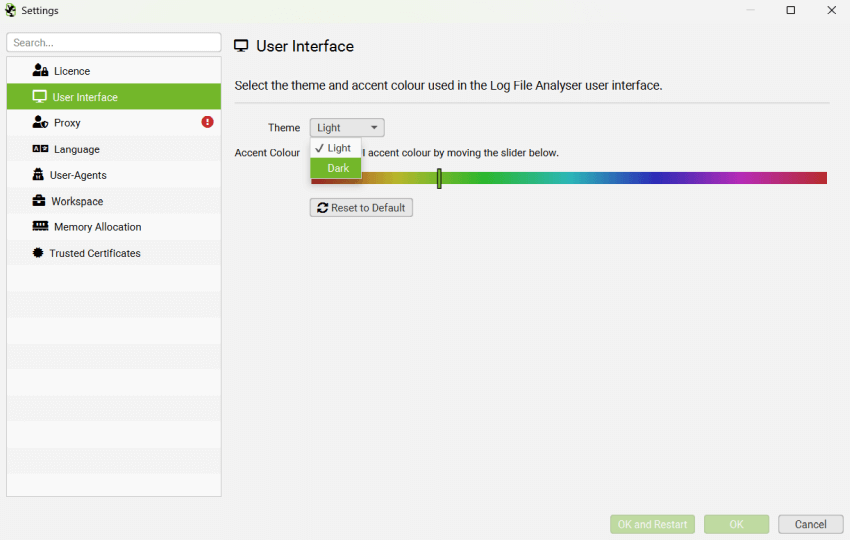
User Interface
There are a few configuration options under the user interface menu. These are as follows –
- Theme > Light / Dark – By default the Log File Analyser uses a light grey theme. However, you can switch to a dark theme (aka, ‘Dark Mode’, ‘Batman Mode’ etc). This theme can help reduce eye strain, particularly for those that work in low light.
- Accent Colour – The Log File Analyser uses green as it’s default colour for highlighting rows, cells and other UI options. However, you can adjust this to your own preference.
Language
The GUI is available in English, Spanish, German, French and Italian. It will detect the language used on your machine on startup, and default to using it.
Language can also be set within the tool via ‘Settings > Language’.
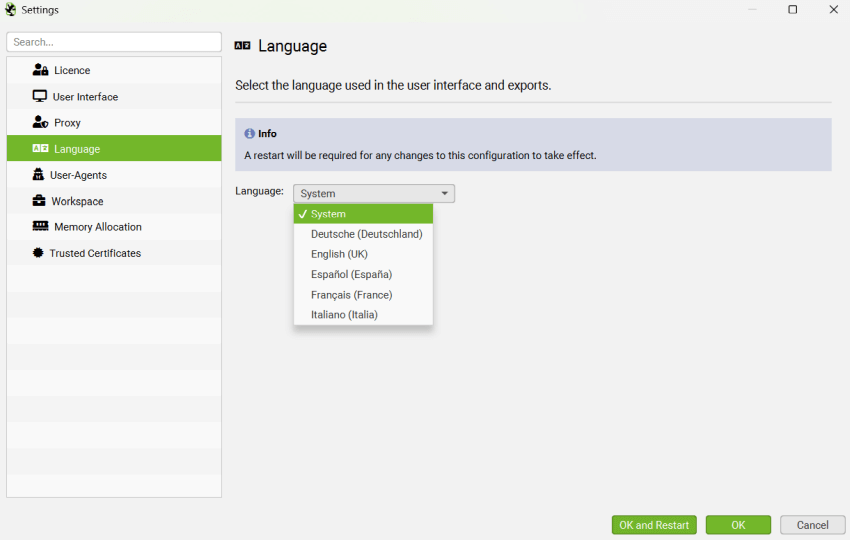
We may support more languages in the future, and if there’s a language you’d like us to support, please let us know via support.
Proxy
The proxy feature allows you the option to configure the Log File Analyser to use a proxy server.
You will need to configure the address and port of the proxy in the configuration window. To disable the proxy server untick the ‘Use Proxy Server’ option.
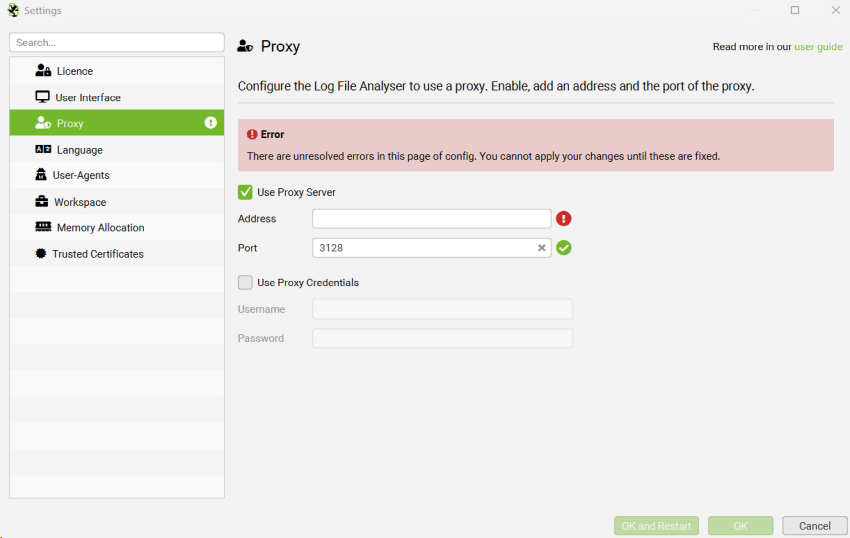
Please note:
- Only 1 proxy server can be configured.
- You must restart for your changes to take effect.
- No exceptions can be added – either all HTTP/HTTPS traffic goes via the proxy, or none of it does.
Workspace
Here you can set an alternative location to store your project data.
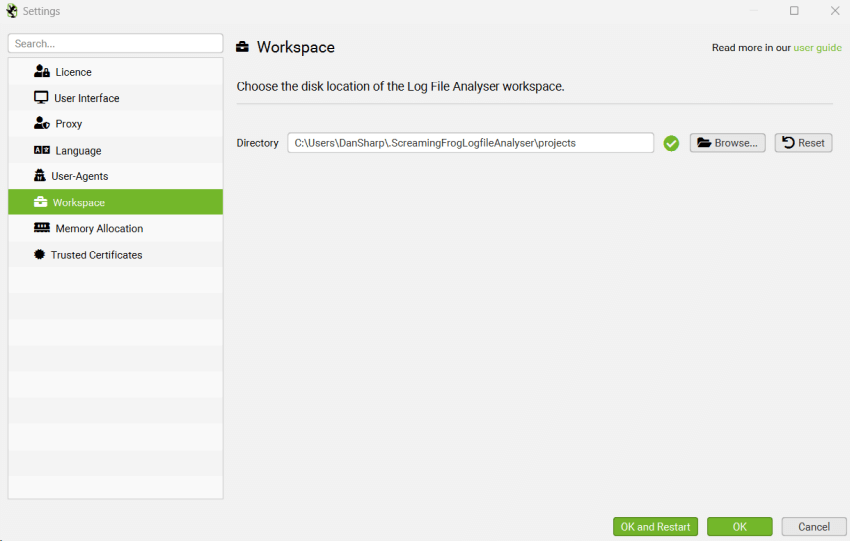
By default the Log File Analyser stores projects in the following locations:
- Windows: {main drive letter}:\Users\{username}\.ScreamingFrogLogfileAnalyser\projects
- macOs: /Users/{username}/.ScreamingFrogLogfileAnalyser/projects
- Ubuntu: /home/{username}/.ScreamingFrogLogfileAnalyser/projects
When choosing an alternative location there are two things to consider, performance and size. The faster the drive, the better the Log File Analyser will perform. Choosing a network drive here is a sure way to kill performance! The Log File Analyser requires at least as much space as the size of the logs you are importing.
Troubleshooting
- If you get a red X rather than a green tick next to Workspace Directory, hover over it to see the error message.
- If the error message includes “OverlappingFileLockException” this means you are using an ExFAT/MS-DOS (FAT) file systems which is not supported on macOS due to JDK-8205404. You’ll need to choose a drive with a different format or reformat your drive to a different format to resolve this. You can use the Disk Utility application to view the current format and reformat the drive.
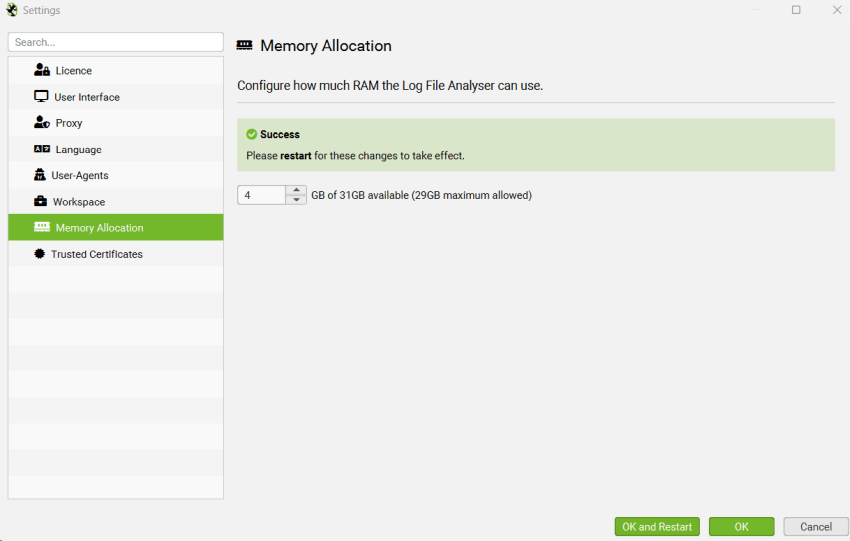
Memory Allocation
The Log File Analyser uses Java which requires memory to be allocated at start-up. By default the Log File Analyser will allow 2gb for 64-bit machines.
The default memory allocation is sufficient for most projects. Please do no adjust this unless advised by the Screaming Frog support team.
Trusted Certificates
A Man In The Middle (MITM) proxy will resign TLS certificates. If a resigned certificate is not from a trusted Certificate Authority (CA), the TLS connection will be rejected.
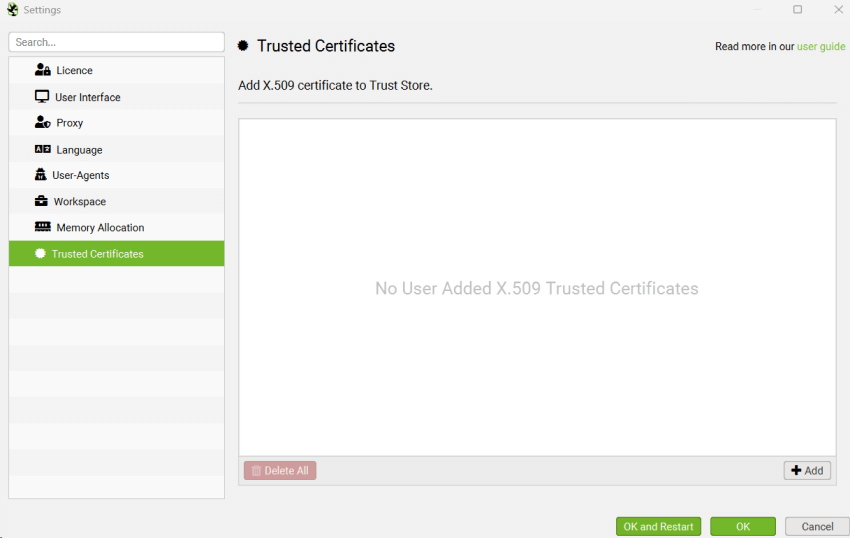
Companies employing this style of proxy will usually distribute an X.509 certificate to employees. This X.509 certificate can be used by the Log File Analyser by adding it to a ‘Trusted Certificates Folder’.
The Log File Analyser will only accept X.509 certificates with the following extensions: .crt, .pem, .cer and .der.
How To Add A Trusted Certificate
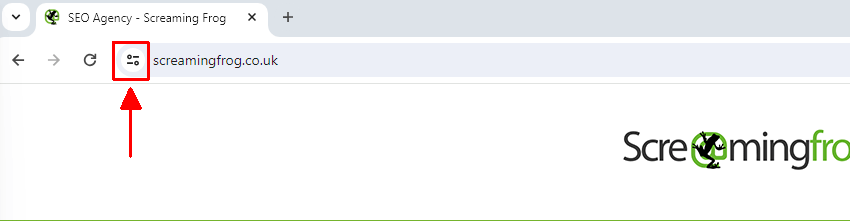
When a proxy is changing the issuer of a certificate, it can be quickly seen in a browser such as Chrome. Simply load the Screaming Frog website in Chrome and click the ‘view site information’ icon to the left of the address.
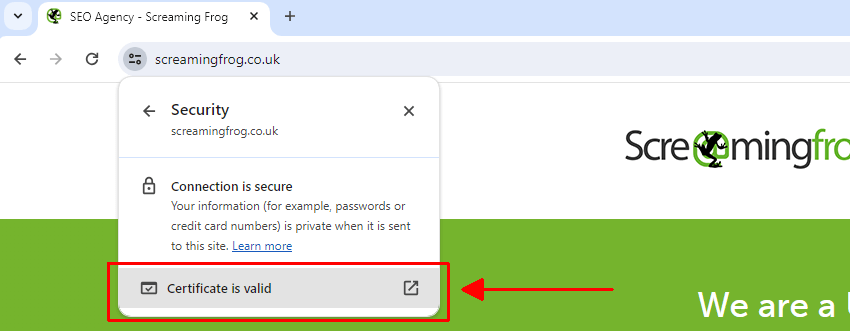
Next, click on ‘Connection is secure’ (or ‘Connection is insecure’) and ‘Certificate is valid’ –
Then click on ‘Details’ and ‘Issuer’ in the ‘Certificate Fields’ section –
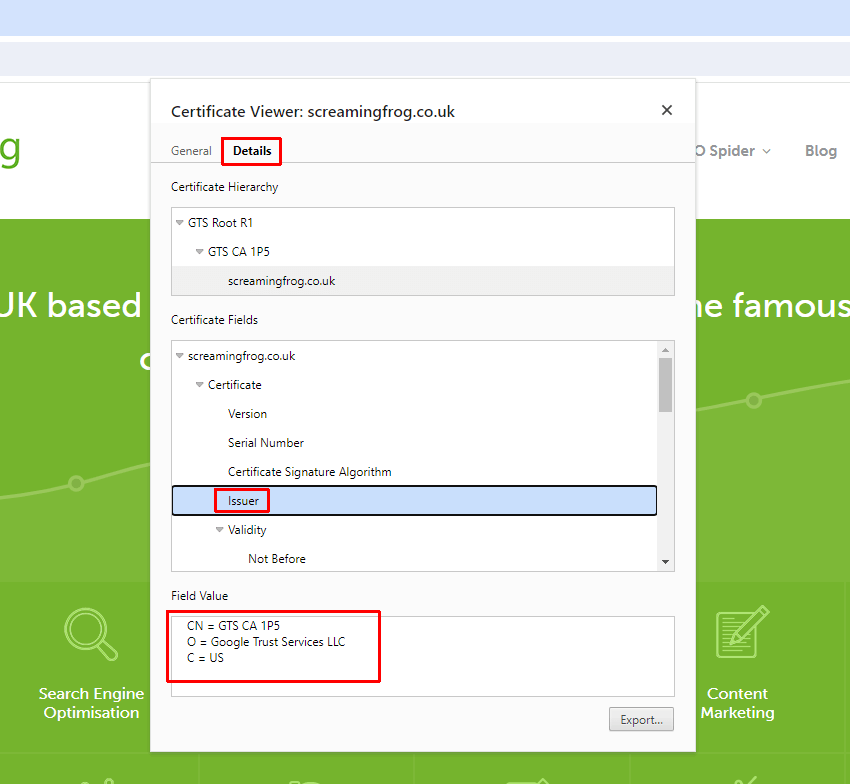
The issuer for the Screaming Frog website shows as “GTS CA 1P5”. But you should see this is as something different, such as your proxy, for example ZScaler or McAfee. This shows the issuer of the certificate is being changed in your local environment.
If this is the case, then follow the instructions below to download the certificate and import into the ‘Trusted Certicates’ store to validate your licence. If you do not, and only see “GTS CA 1P5” as the Issuer, then you’ll need to contact your IT team to request the certificate directly from them.
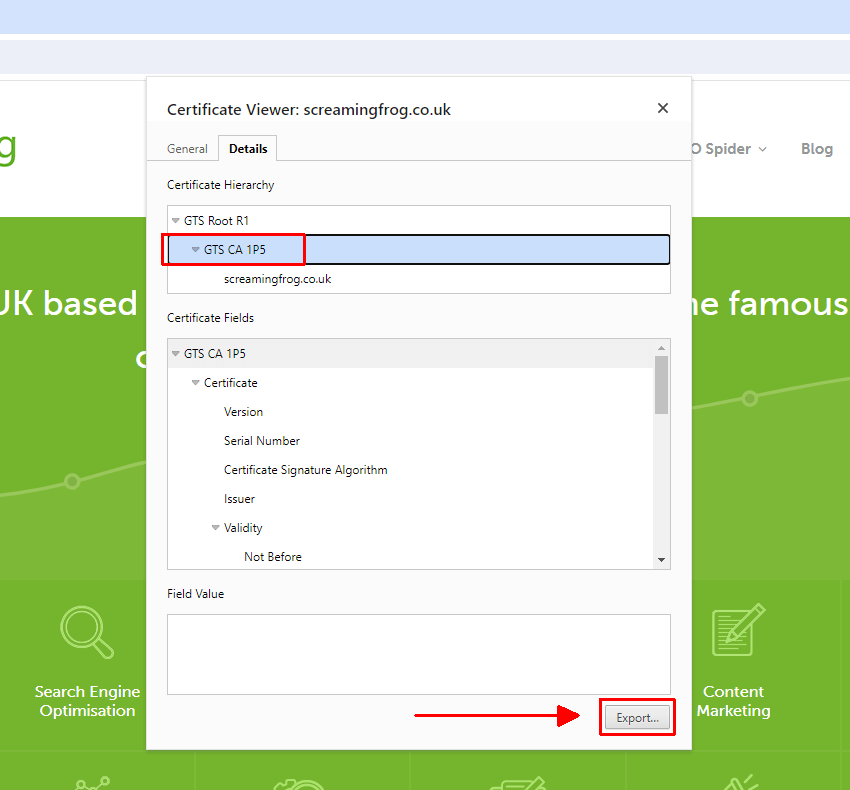
If you are seeing “ZScaler, McAfee etc” as the issuer certificate, click on it and then ‘Export’ at the bottom. Note that our example image shows “GTS CA 1P5”, which is the actual issuer for this site. Yours will be another issuer that the proxy has used for resigning.
Then ‘Add’ this certificate file to the Log File Analyser Trusted Certificates trust store.
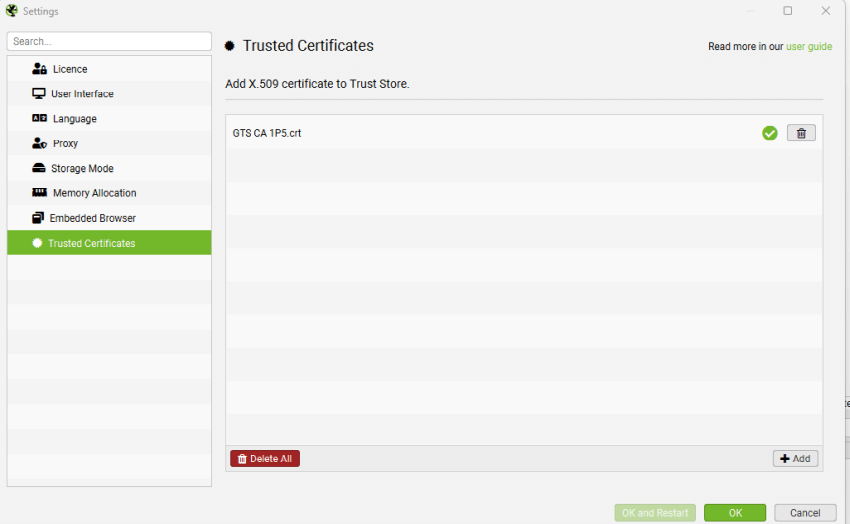
You should then be able to validate your licence.


