Log File Analyser General
User Guide
Introduction
The Screaming Frog Log File Analyser was developed to help SEOs analyse log files to gain invaluable insight into search bot crawl activity. It’s a desktop application that you can download and install locally on a PC, Mac or Linux machine, that allows you to drag and drop your raw access log files into the interface for analysis.
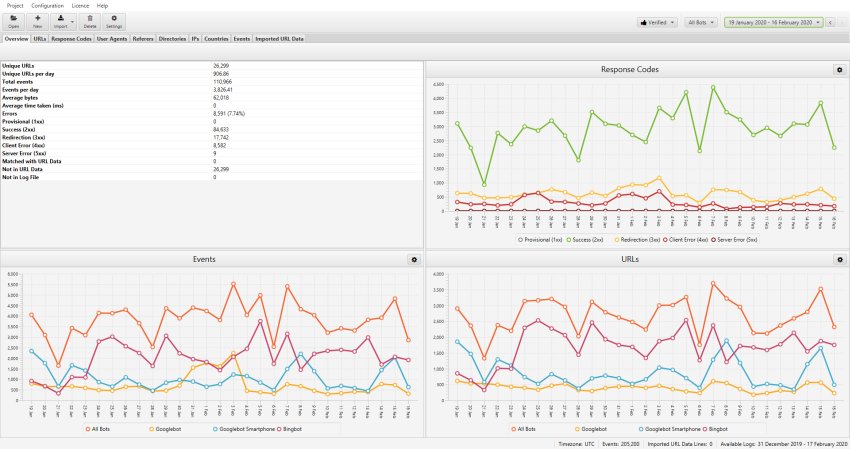
The Log file Analyser is free for analysing up to 1,000 log events in a single project. If you’d like to analyse more than 1,000 log events and have multiple projects, then you can purchase a licence for £99 (GBP) per year.
The ‘Imported URL Data’ feature where you can upload and match data which have the same URLs (a VLOOKUP, without the required knowledge) is completely unlimited in the free version.
Read our 22 Ways To Analyse Logs Using The Log File Analyser guide for inspiration on how to analyse data.
Installation on Windows
These instructions were written using Windows 10 are valid for all recent versions of Windows.
Download the latest version of the Log File Analsyer. The downloaded file will be named ScreamingFrogLogFileAnalyser-VERSION.exe. The file will most likely download to your Downloads directory which can easily be accessed via File Explorer. The download may pause at 100% complete while Windows performs a security scan.
Installation
The downloaded file is an executable that must be run to install the Log File Analyser. Go to your Downloads folder in File Explorer, double click on the downloaded file.
Command Line Installation
You can also install silently via the command line as follows.
ScreamingFrogLogFileAnalyser-VERSION.exe /VERYSILENT
By default this will install the Log File Analyser to:
C:\Program Files (x86)\Screaming Frog Log File Analyser
You can choose an alternative location by using the following command:
ScreamingFrogLogFileAnalyser-VERSION.exe /VERYSILENT /DIR=C:\My Folder
Troubleshooting
- “Error opening file for writing” – reboot your computer and retry the installation.
Uninstall
Click the Start icon in the bottom left of your screen and type ‘add’ to find ‘Add or remove programs’ in the Control panel.
Click the search box and enter “Log” to find Screaming Frog Log File Analyser in the list of app. Now click the three dots to the right and select “Uninstall” from the drop down.
During the uninstallation process you’ve be asked if you would like to delete all your crawls, setting and licence information.
Uninstall via the Command Line
You can perform a silent uninstall of the Log File Analyser as follows:
"C:\Program Files (x86)\Screaming Frog Log File Analyser\unins000.exe" /SUPPRESSMSGBOXES /VERYSILENT
Running the Log File Analyser
Click the Start icon in the bottom left of your screen, type “Log File Analyser” to find it, then click on it to start,
Installation
The Screaming Frog Log File Analyser can be downloaded and installed by clicking on the download button and then running the installer.
The minimum specification required is a PC, Mac or Linux machine able to run Java 17 with at least 2GB of RAM free. As the application is installed and runs locally, the size of the log file you can import will be dependent on your own machine’s hard drive space. We recommend at the very minimum 1GB of free space, but it will be dependent on the size of the logs.
For the best possible speed of importing log files, reading, filtering and sorting data, we highly recommend super fast solid-state drives (SSD’s). SSD’s significantly speed up the reading of log file files and generation of reports and views within the software.
Projects
A new project is created when you import a log file. In the free version of the tool, you’re limited to a single project. In the paid version, you can have as many projects as you like. We recommend creating separate projects for each website and adding log files to the project over a period of time. However, how you use projects is up to you!
You’re able to open new or existing projects within the Screaming Frog Log File Analyser at anytime.
Setting Up A New Project
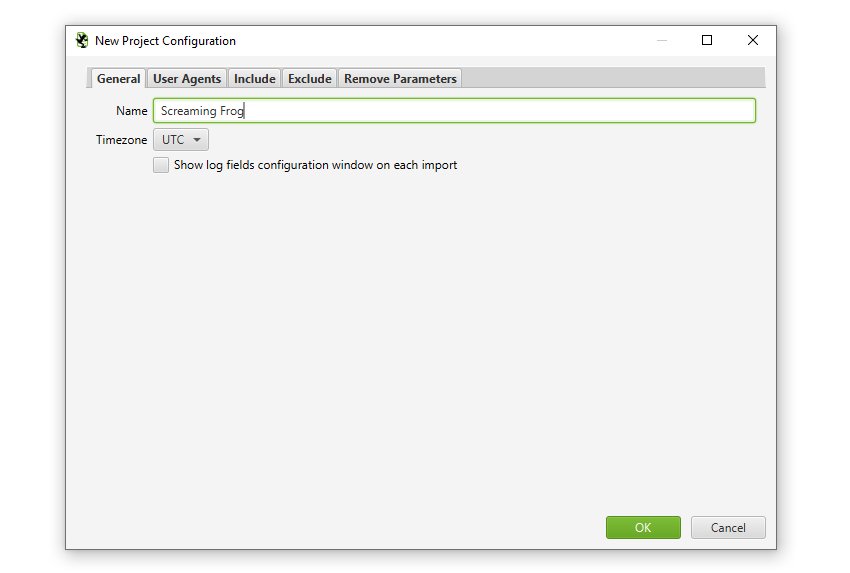
To open a new project, simply click on the ‘New’ button, or ‘Project > New’ within the top level menu. You’ll then be requested to name the project and choose the timezone. You can rename projects at a later date as well.
You can also click the ‘User Agents’ tab to configure the user-agents analysed in the project. By default the Log File Analyser only analyses search engine bot events, so the ‘Filter User Agents (Improves Performance)’ box is ticked.
We recommend only selecting user-agents you’re interested in analysing, as it massively improves performance and reduces time required to only have to store and compile specific search bots, rather than all event data from users and browsers.
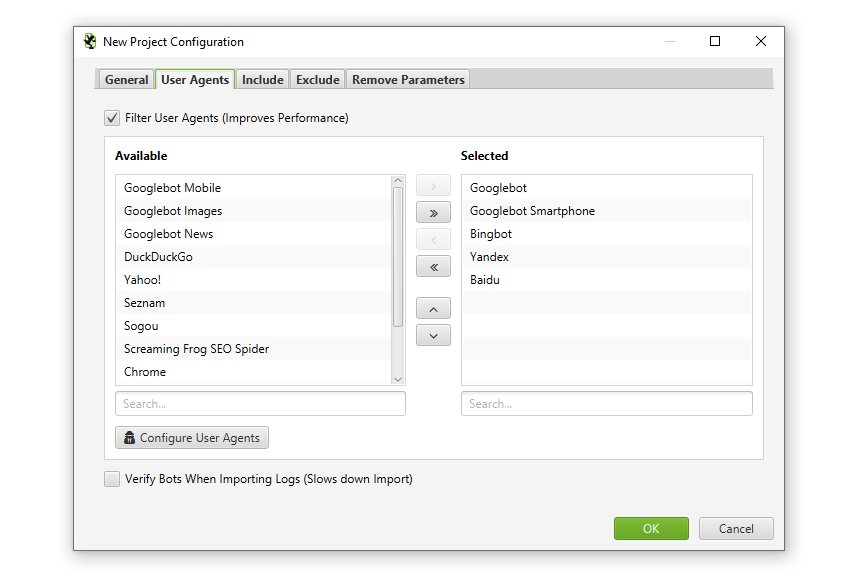
At the bottom of this window you can also choose to ‘verify bots‘ when importing logs. This will make the initial log file import take longer, or alternatively you can perform this after importing.
The Log File Analyser will by default import data for the following search bot user-agent strings –
- Googlebot
- Googlebot Smartphone
- Bingbot (Both Desktop & Smartphone together)
- Yandex
- Baidu
However, you can choose to unselect or add additional user-agents to these.
The ‘Include’ tab allows you to supply a list of regular expressions for URLs to import into a project. So if you only wanted to analyse certain domains, or paths, like the /blog/, or /products/ pages on a huge site, then you can now do that to save time and resource – and more granular analysis.
If you want to analyse every URL, you can simply ignore this tab and leave it blank.
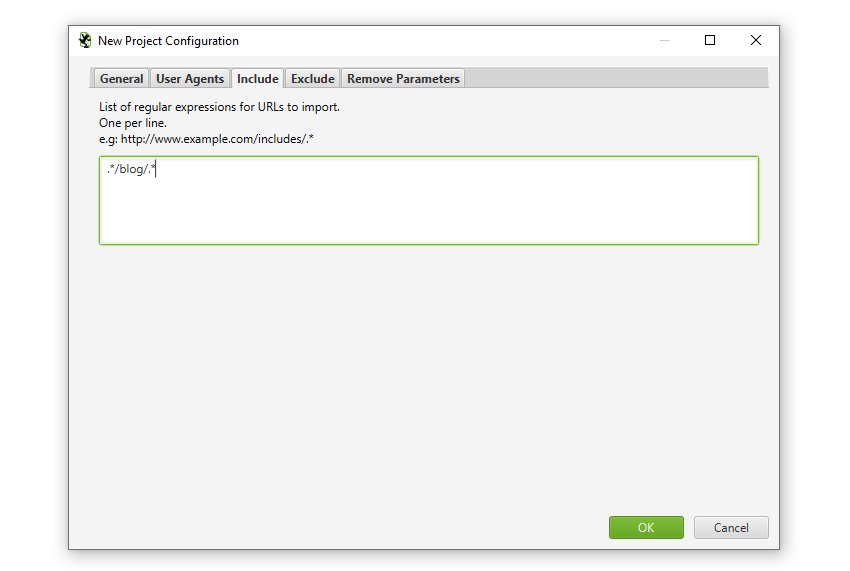
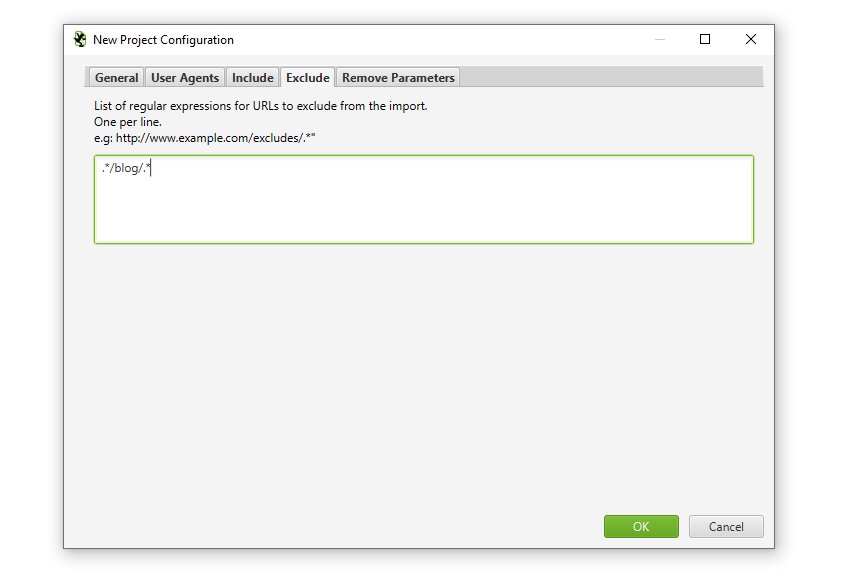
The ‘Exclude’ tab allows you to supply a list of regular expressions for URLs to exclude from importing into a project to help save time and resource.
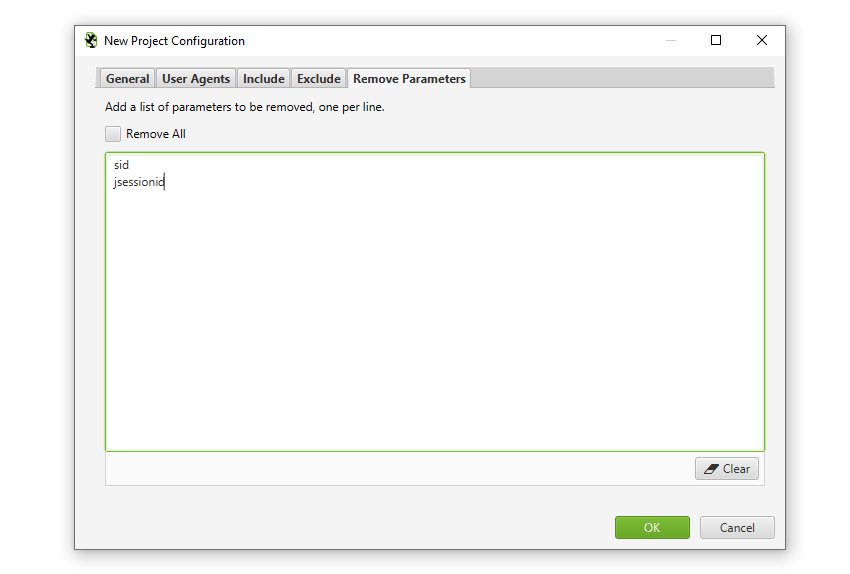
The ‘Remove Parameters’ tab allows you to input a list of URL parameters to be stripped from URLs in the log file for analysis.
If the URLs in the log file are relative, rather than absolute, you’ll also be asked to supply the full site URL, including protocol (HTTP or HTTPS). Just enter the URL in the window.

Generally HTTP and HTTPS log files will be separate, so this enables you to upload them separately with the correct protocol and have HTTP and HTTPS URLs within the same project for analysis.
We recommend (where possible) that absolute URLs are configured in log files to improve accuracy of data. When URLs are relative, we have to combine and aggregate the www. and non www. event data of URLs.
That’s it, when you have finished clicking ‘OK’, the Log File Analyser will create a new project. You can then simply import your log files by dragging and dropping them into the interface.
Open An Existing Project
To open an existing project, click on the ‘Open’ button, or ‘Project > Open’ within the top level menu.
Additionally, you can use ‘Project > Open > Recent’ to choose from a list of recently opened projects.
Deleting A Project
To delete an existing project, click on ‘Project > Delete’ within the top level menu when you’re on the chosen project.
Alternatively, you can click on ‘Project > Open’ within the top level menu, highlight the project you wish to delete and press the ‘Delete’ button at the bottom of the window.
Importing Log Files
The Screaming Frog Log File Analyser is able to import log files from a variety of formats. The links below explain each format, provide examples logs to download and well as detail mandatory and optional fields.
- WC3
- Apache and NGINX
- Amazon Elastic Load Balancing
- HA Proxy
- JSON
- CSVs and TSVs
You can import single, or multiple log files and folders at a time and they can be compressed (zipped or gzipped). You do not need to specify the format of log files, the Log File Analyser will automatically recognise the format.
The Log File Analyser stores log event data in a local database, enabling it to analyse very large log files with millions of events. The larger the log file, the more time it will take to store the data on import and then generate ‘views’ in the tool (tabs, filtering and searching).
Drag & Drop Log Files
To import log files, drag and drop the log file(s) into the application in any tab, apart from the ‘Imported URL data’ tab. Alternatively, you can use the ‘Import > Log File’ button, or ‘Project > Import Log File’ option in the top level menu.
When you open a new project, the main window pane will show the following message where you can simply drag and drop the log file(s) –

Customise Log Fields & Debug
In the New Project configuration you can choose to ‘Show log fields configuration window on each import’ in the General tab.
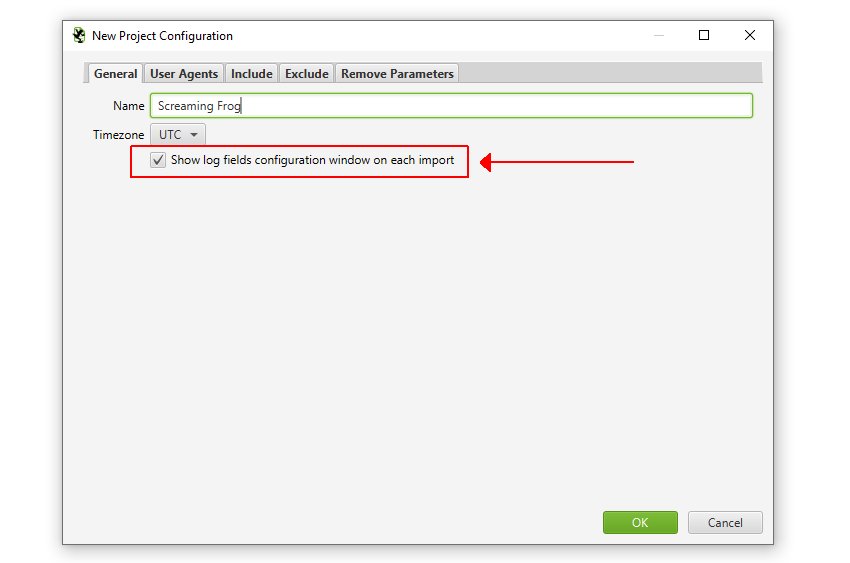
While the LFA can automatically parse virtually all log formats, this is useful when log files are extremely customised, or a required field is missing.
You’re able to preview what’s in the log file and which log file components have been selected against which fields in the tool, and adjust if necessary.
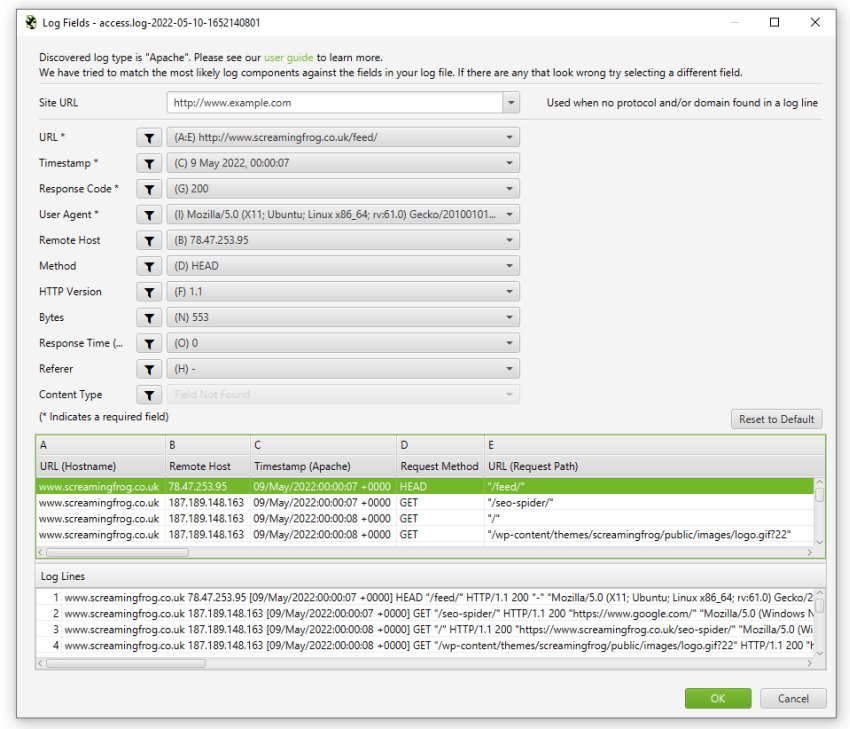
This is an advanced feature, and in general is intended for more complex use cases.
Importing Additional Log Files Into A Project
You can continue to import additional data in the same way described above into an existing project, by dragging and dropping additional log files, which will add to the data in the project, rather than overwrite it.
If you make a mistake, or decide to remove some data, you can view (and delete) imports under ‘Project > Import History’.
Importing URL Data
The ‘Imported URL Data’ tab allows you to import CSVs or Excel files with any data associated with a URL. For example, you can import crawl data, URLs from a sitemap or a ‘top pages’ export from Majestic or OSE. The Log File Analyser will scan the first 20 rows to find a column containing a valid URL. This url must contain a protocol prefix (http/https).
You can import multiple files and data will be matched up automatically against URLs, similar to VLOOKUP. At the moment, you can’t import directly from a sitemap, but you can upload the sitemap URLs into a CSV/Excel and into the ‘Imported URL Data’ tab.
Combining crawl data with log file events obviously allows for more powerful analysis, as it enables you to discover URLs which are in a crawl, but not in a log file, or orphan pages which have been crawled by search bots, but are not found in a crawl.
Importing Crawl Data
You can export the ‘internal’ tab of a Screaming Frog SEO Spider crawl and drag and drop the file directly into the ‘Imported URL Data’ tab window. Alternatively you can use the ‘Import > URL Data’ button or ‘Project > Import URL Data’ option in the top level menu. This will import the data quickly into the Log File Analyser ‘Imported URL data’ tab and database.
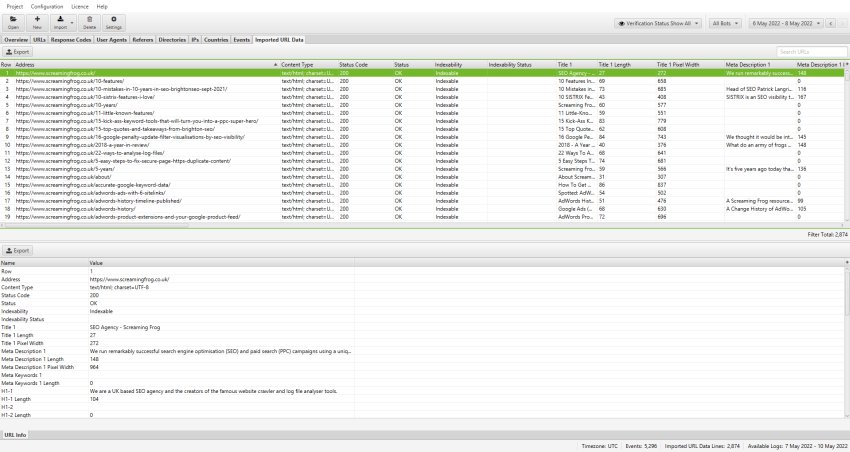
The ‘Imported crawl data’ tab only shows you the data you imported, nothing else. However, you can now view the crawl data alongside the log file data, by using the ‘View’ filters available in the ‘URLs’ and ‘Response Codes’ tabs.

The Log File Analyser defaults to ‘Log File’, but if you change the view to ‘Matched With URL Data’ it will show you crawl data alongside the log file data (scroll to the right).
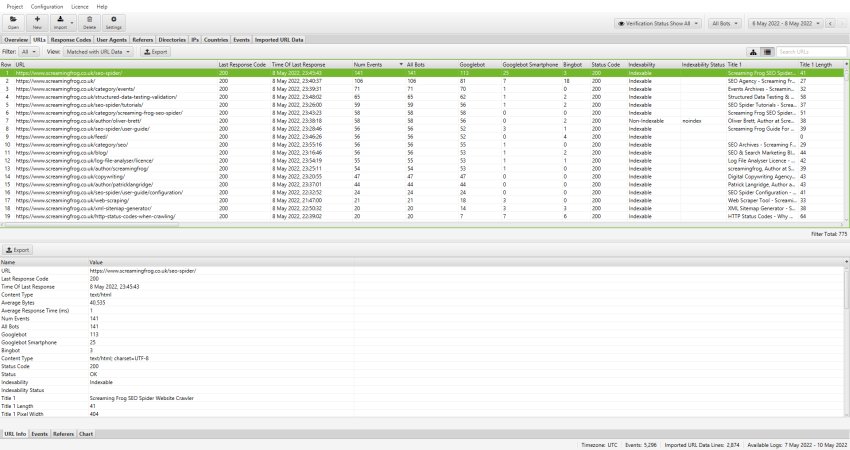
‘Not In URL Data’ will show you URLs which were discovered in your logs, but are not present in the crawl data imported. These might be orphan URLs, old URLs which now redirect, or just incorrect linking from external websites for example.
‘Not In Log File’ will show you URLs which have been found in a crawl, but are not in the log file. These might be URLs which haven’t been crawled by search bots, or they might be new URLs recently published for example.
Deleting Imported URL Data
You can quickly delete the ‘Imported URL data’ from a project by clicking on ‘Project > Clear URL Data’ in the top level menu options.
Please note, once the data has been deleted, it can’t be recovered unless you import the data again.
Migrating Data to a New machine
The Log File Analyser doesn’t have an offical way to export/import projects. When moving to a new machine the easiest thing to do is to simply create a new project and reimport the log files. If you would like to copy your existing projects instead, you’ll have to copy over your projects folder. You can find the location of this by going to Configuration->Workspace.


