Create Custom Heatmap Audits With the SEO Spider
Miloš Gizdovski
Posted 21 October, 2024 by Miloš Gizdovski in Screaming Frog SEO Spider
Create Custom Heatmap Audits With the SEO Spider
Ten years ago, I was searching for a tool that would help me determine what was wrong with a website I was working on.
While scrolling through posts on a forum, I noticed that people had been praising a tool that had a catchy name, as opposed to all the other “SEO-something-something” tools. So I gave it a shot.
This article is a guest contribution from Miloš Gizdovski, Operations Manager at Lexia.
It’s October 2024 now, I’m still using this tool, and the name is quite familiar in the SEO community — Screaming Frog SEO Spider Tool.
Looking back, I can’t imagine doing any kind of technical SEO audit without it. None of my colleagues at Lexia marketing agency can either.
We’re happy when that “New version available” message pops up as it feels like a movie trailer we’ve been looking forward to for months has finally been released.
A few years ago, one of our new clients had hundreds of blog posts on their website. After the usual procedure and initial audits, I wanted to create something that will help me determine which of those posts were actually worthy focusing on.
I saw a map of users’ scores for each episode of Game of Thrones, so I thought it would be cool to use something similar for the blog posts. This would show each month’s data in terms of organic users, sessions, bounce rates, conversion, clicks, impressions, and average positions.
After several tries, I managed to create a report that could be applied to any website.
These reports have a name – Lexia Heatmaps, or just Heatmap reports if you like.

Lexia Heatmaps show a trend of specific parameters over a period of several months or even a year. However, instead of just one page, the reports show the trend for all pages at the same time. This way, nice looking reports that can reveal a lot of possibilities or threats are created.
The following sections of this article will describe how to create a heatmap report for any group of similar pages.
The blog section will be used as an example, but this can be applied to, for example, products or collections of products as well.
A quick note — it will require some familiarity with Excel functions to create the heatmaps, as they are a bit more advanced than the SEO reports that you can export directly from Screaming Frog SEO Spider. Don’t worry, I will show you how to do it step by step!
First Step – Collect the Blog Posts
Obviously, the first step would be to export the list of blog posts in order to create the heatmap.
There are several ways to do this:
- Manually collecting the URLs
- Creating a custom extraction in the SEO Spider tool
- Exporting the links from the sitemap
The first option is the most time consuming. Not a problem for a website with 10 blog posts, but try doing this with those counting over a hundred.
The second option is using the SEO Spider tool. You can create a custom extraction by picking the specific elements, for example:
- /blog/ path in the URL
- Author’s section
- Publishing date
However, I find that the third option, which is using the sitemap, is the most suitable one.
If you’re lucky, there will be a “Post” sitemap, where all the blog posts are hosted. This comes in handy in cases where the blog posts don’t have /blog/ in the URL.
Second Step – Prepare the SEO Spider Tool
Now that you have a list, you can proceed with gathering the data. There are two things you need to do before running the crawl.
The first one is adjusting the crawl mode, and the second one is setting up the API.
Crawl options can be found in Mode settings, and here you have to select the List.
Look for the API under the Configuration options. For the purpose of this article, I will choose Google Analytics 4, which is one of the several options available for selection.

After the API Access window opens, sign in with a Google account that has access to Analytics.
The main tab of the API Access will now show this:

Here is where you can choose the account — pick the one you need and be sure to select the right property and data stream. In my case, the website has only one property and data stream, so I will keep it as All Data Streams.
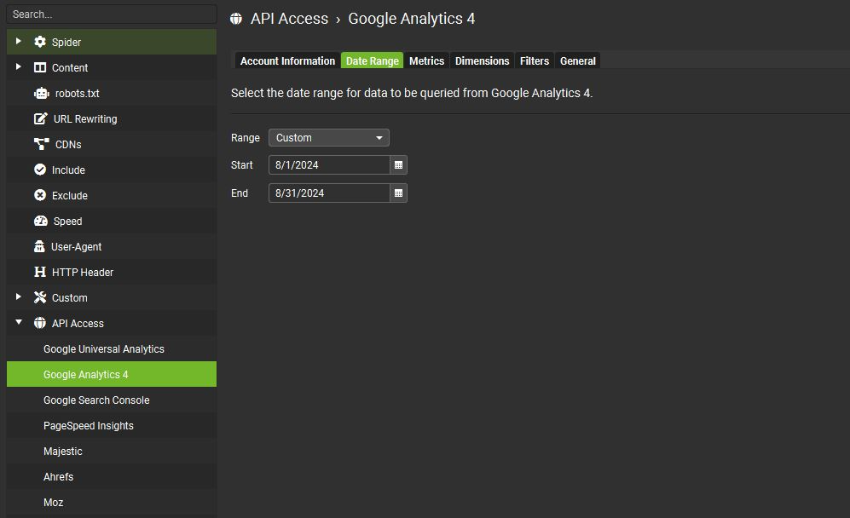
The next step is setting up the Date Range, which is the tab next to the Account Information:
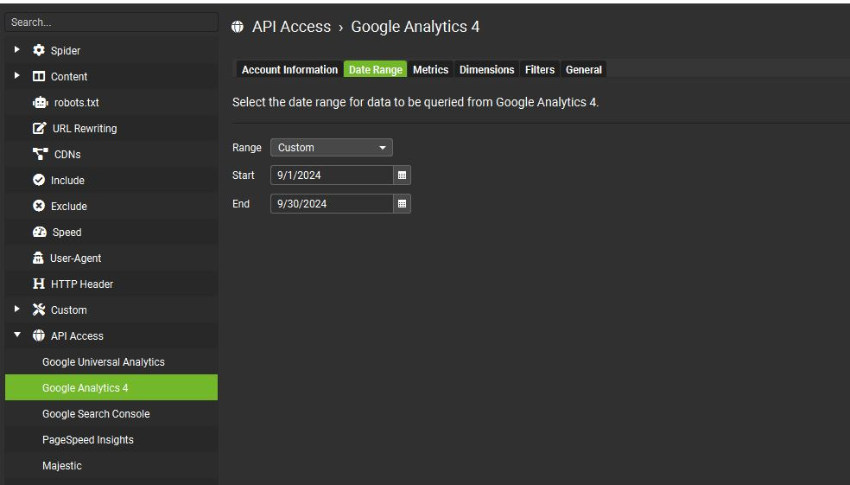
We have to run a new scan for each month, but remember — this only makes sense if the month is over. So, I’ll start with September 2024, as I have all the data for September ready.
The next tab is Metrics.
Since I already have the Sessions included by default, I will leave everything as is.
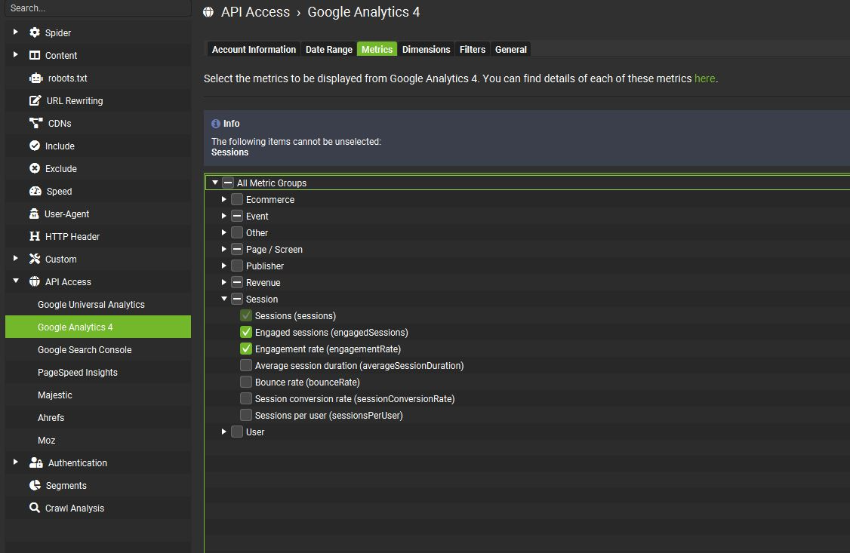
However, if I wanted to create a heatmap of the Average session duration, I would need to check this parameter in the Session list, and it would be included in the results.
Lastly, there is one more tab that we need to adjust – Filters.
Since you want to check the organic performance of the blog posts, here is what you need to select:
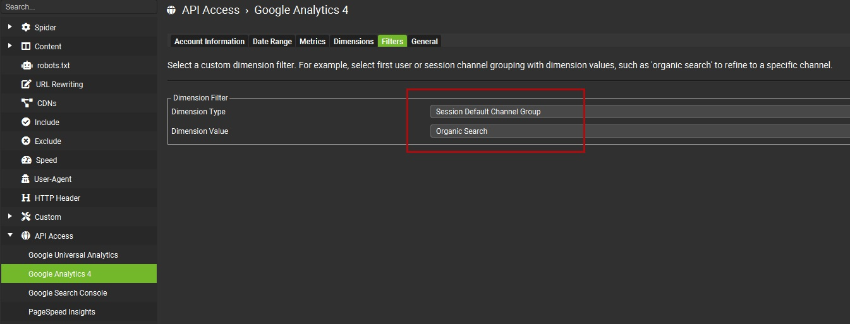
I didn’t include Organic Social because, for this experiment, I’m only interested in users that came from the organic channels.
If you want to check the users coming organically from social media, or even the Direct traffic users, you can do it as well! Just select the channel and your heatmap will show the trend of direct traffic MoM or YoY.
Third Step – The Results
We are now ready to start the crawling process and get organic sessions data for the month of September.
I already mentioned that you have several options for uploading the list of URLs using the List mode:
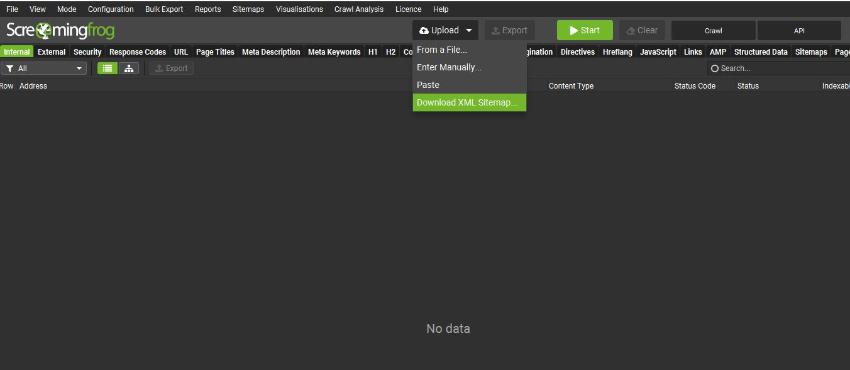
In my case, I just pasted the URL of the sitemap.
This is the best option for situations where a lot of blog posts have been published since the last time you updated the heatmap, and here is why:
Whenever you publish a blog post, it will end up in the sitemap, so search engine bots could discover it. By adding the sitemap URL to the SEO Spider tool, it will read all URLs.
If you simply paste the previous month’s list, you will miss the opportunity to track the performance of the new blog posts that have been published since. Most of these new blog posts will have just a few sessions but, after all, they should be tracked from the beginning.
After the crawl is over, head to the Analytics section and check the All reports:
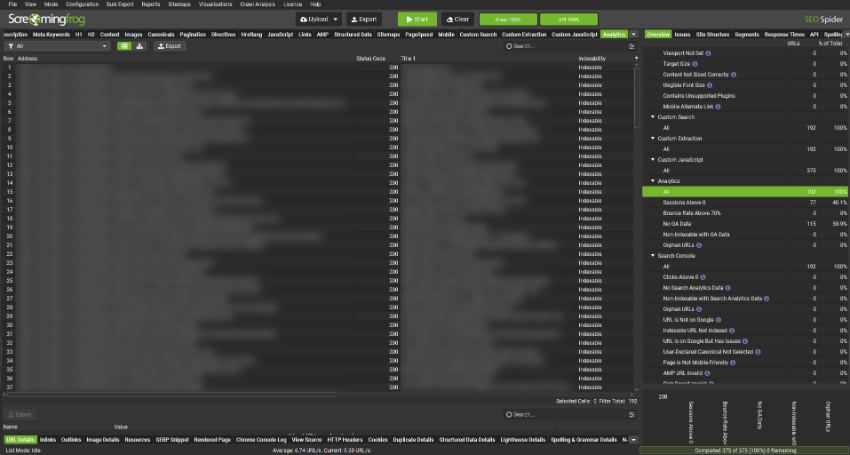
Slide the results to the right and you will see the scores from GA4. The GA4 Sessions is the column we are looking for:
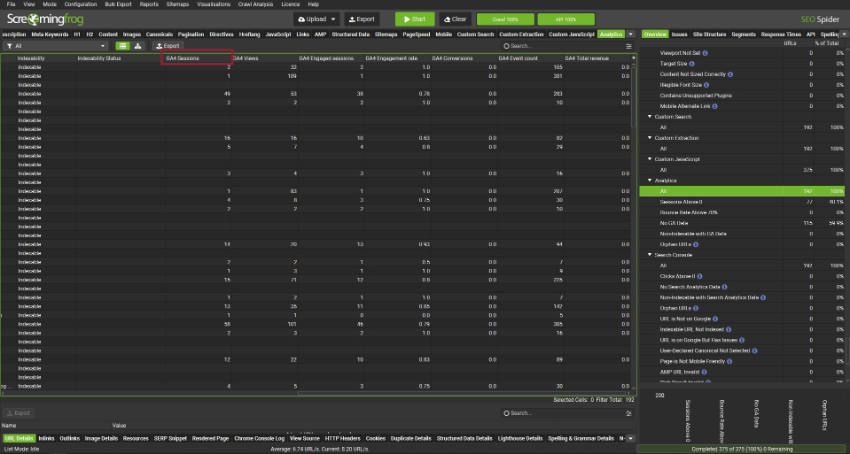
All the numbers in that column are the GA4 organic sessions for each page individually.
The process of gathering September data is done, so now we have to add it to the heatmap list.
Fourth Step – Data Entry
We have two scenarios here:
- You are building the heatmap ground zero.
- You already have the heatmap done, and you just need to this month’s data
Both of these cases follow the same process, but of course, you’ll need more time to create everything from scratch.
Scenario #1 – Creating a New Heatmap Report From the Start
In our example, the reports are created in Google Spreadsheets. The blank report looks like this:
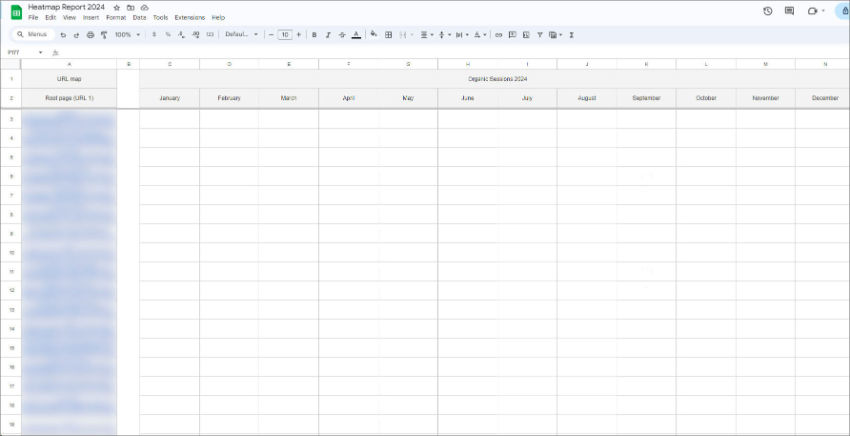
There are two main sections here.
On the left, there is the URL map section, where the list of all blog posts should be added.
On the right, you can see the months and Organic Sessions 2024 in the header. This is where the results from the SEO Spider tool will go.
Since we started with an empty document, I will just copy and paste the results from the SEO Spider tool:
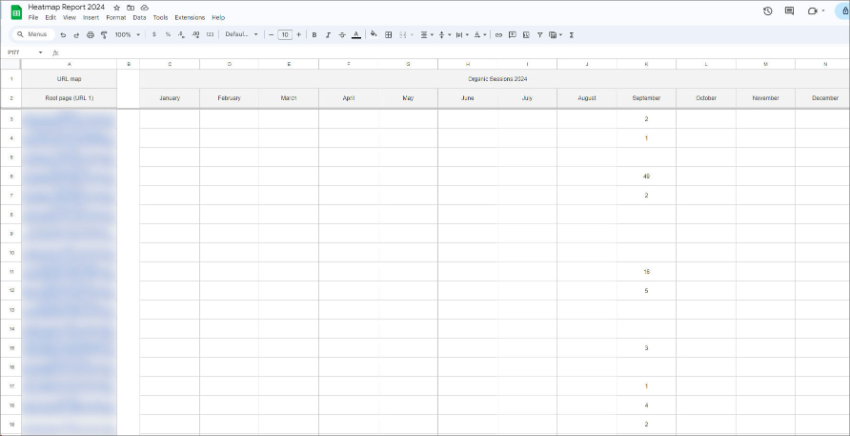
This process should be repeated for all months, meaning that you will need to adjust the Date Range and include only August.
In order to do this, you first need to Clear the crawl and then go the API section and adjust the Date Range:
The next part is very important — the new crawl will re-order the URLs, so don’t simply copy and paste the GA4 Sessions results.
Go the main Export option and export each monthly crawl instead:
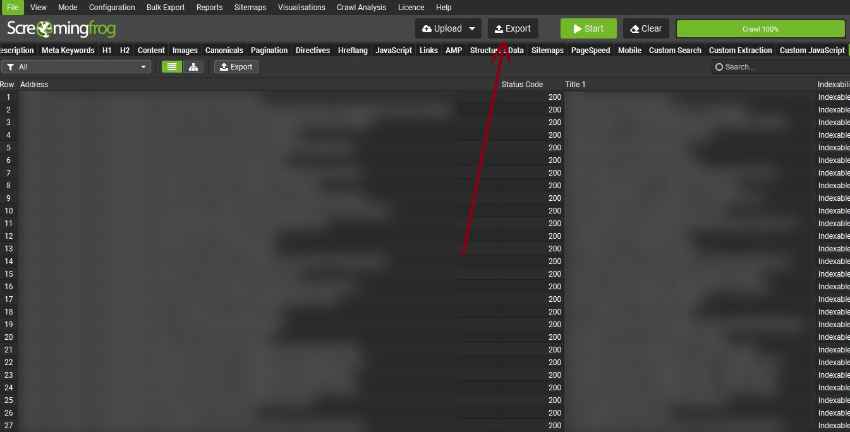
The order of the original list will stay the same in the exported file (.xlsx), so you just have to get to the GA4 Sessions column, which was the BQ column for me.
Once you have everything sorted and all months added to the reports, it’s time for the last step – adding the colors.
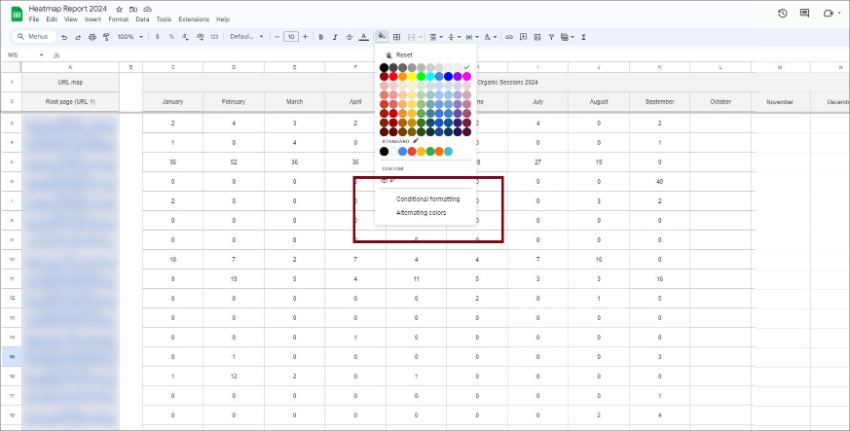
In Google Spreadsheets, you can easily do this by selecting the range of cells and applying the Conditional formatting. The process is almost the same as in Excel.
Go to the Conditional formatting option:
On the right side, you’ll see a new window with various options. It will be Single color by default.
Select the range by clicking on the small windows icon:
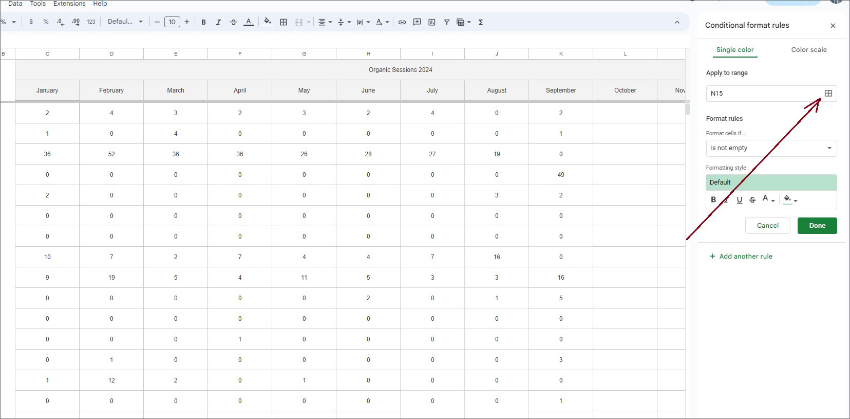
I will select everything between columns C and N. Now we have to format the rules.
The first rule will be that if the cell is equal to 0, the cell color should be light red:
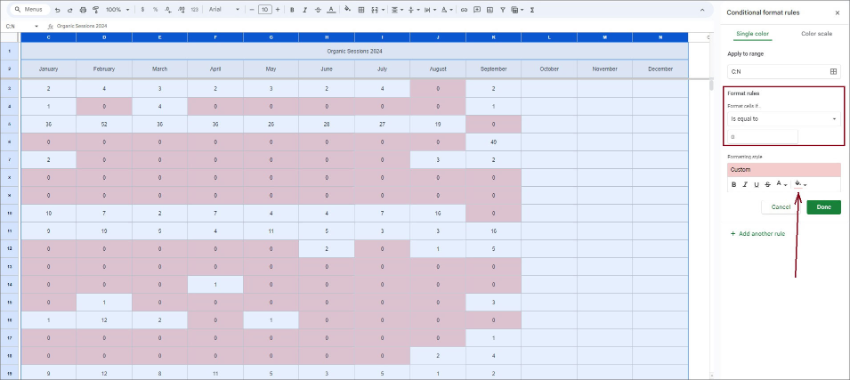
Now, while you’re still in the editor, click on the + Add another rule, just below the Cancel / Done button. It will open another formatting option within the same range.
You now have to apply another rule, but think about this one. Some websites will have a lot of traffic, so adding values between 1-10 would be a waste of time (and color).
In such cases, even values between 1 and 100 could represent the low-traffic blog posts.
In this example, I will use lower values to create the heatmap report:
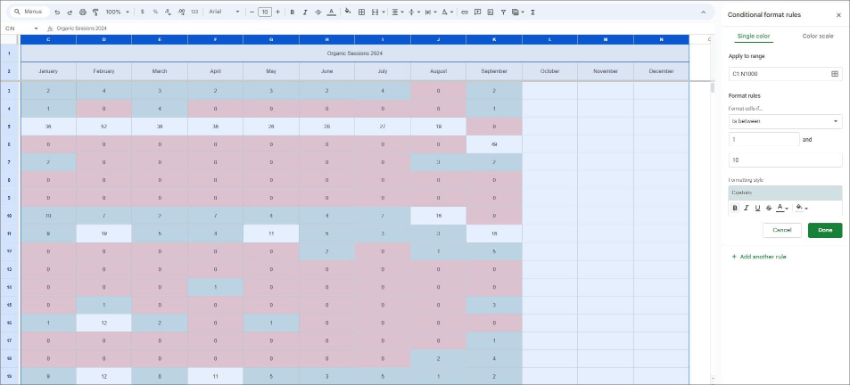
After all the “between” rules are defined, the last one could simply be “greater than”:
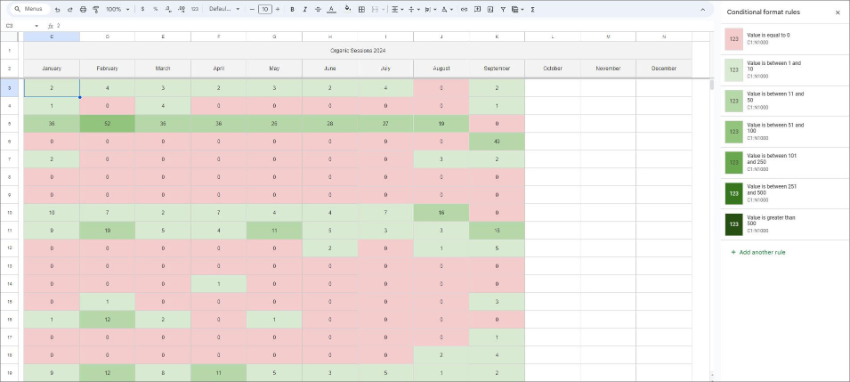
The heatmap is now finalized.
A few tips to keep in mind while creating the format rules:
- Tip #1 Decide which color should show zero traffic and which one should show all positive values. I pick light red for zeros and variants of green for positive numbers.
- Tip #2 Define the “between” values, but don’t forget about the end values as they shouldn’t overlap. For instance, if you have a rule from 1-10, the next one should start with 11.
- Tip #3 Use gradients of the same color. This will help you determine the trend more easily.
- Tip #4 The last color variants will be darker, so it would be good to change the color of the text from dark to white. This will help you see the values properly.
- Tip #5 You don’t have a lot of color options by default. Choose the between values wisely.
Scenario #2 – Updating an Existing Heatmap Report
Let’s imagine you have to add previous month’s values to the existing list. However, you’ve published some articles since the last Heatmap report update, so you have to use the Sitemap upload option.
The order of the URLs will not match the one you already have in the Heatmap report.
There are several options to match the URLs, depending on how many new articles you have published.
Option 1
If you haven’t published many new articles, you can just manually add them to the Heatmap report list.
Copy your updated Heatmap list to an empty Excel file and save it. After that, set up the SEO Spider tool’s API and change the mode to List.
Instead of choosing the Download XML Sitemap option, choose From a file. Upload your Excel file, run the crawl, and hit the main Export button.
Find the GA4 Sessions option and copy data to the Heatmap report.
Option 2
If you have published a lot of new blog posts, it will take some time to manually add them to the list.
You can use Excel to identify the new articles instead.
Set up the API for the new month and run the usual crawl from the sitemap (mode List, upload option Download XML Sitemap).
Then, paste the URL list to one column and GA4 results to the other column of an Excel file, let’s say column A and B.
In the fourth column (D) just paste the list of the URLs from your Heatmap report. I like to keep one column empty (column C), just to have better visualization when the real URLs are there.
It will look like this:
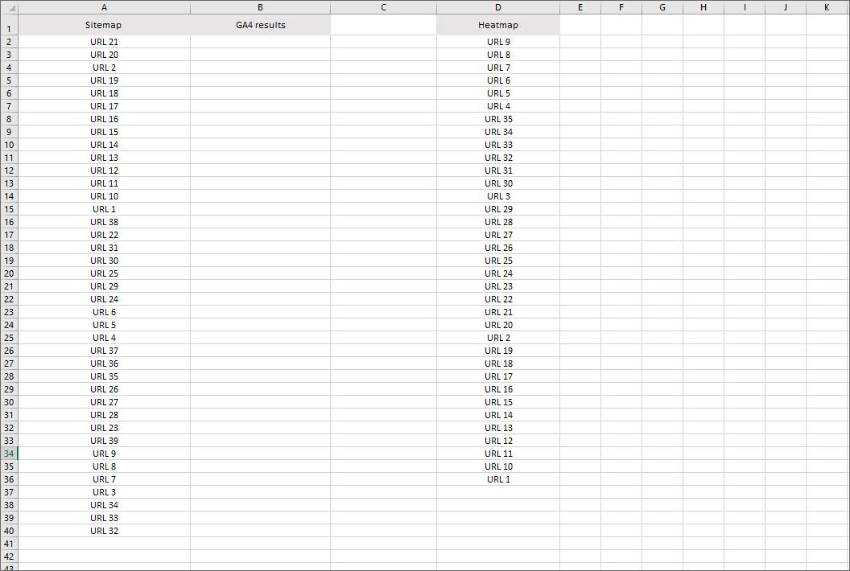
The columns will have different URL orders — this will happen when you upload the list from the sitemap and your Heatmap report.
These two lists will not have the same number of rows because of the newly published articles. The Sitemap column will have more rows in this case.
So, we need to match two URL lists that have different order and assign GA4 Session values to the Heatmap list using a VLOOKUP function.
Go to the column E, add a new header (Heatmap GA4 results) in first row and create this function:
=VLOOKUP(D:D,A:B,2,FALSE)
meaning:
Match the entire content of A and D columns, and then assign values from column B to the corresponding cells in column D.
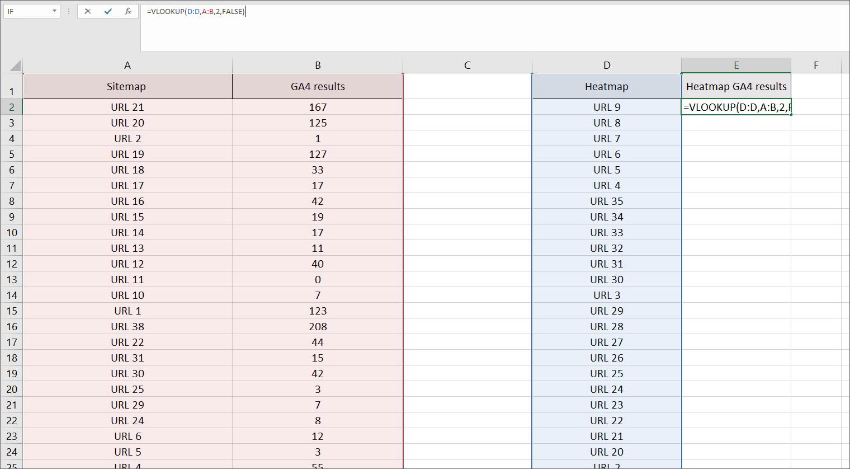
Apply the function to all cells.
Here is the result, you can see how the GA4 Sessions for the URL 2 (Sitemap list) is now present in the Heatmap list as well:
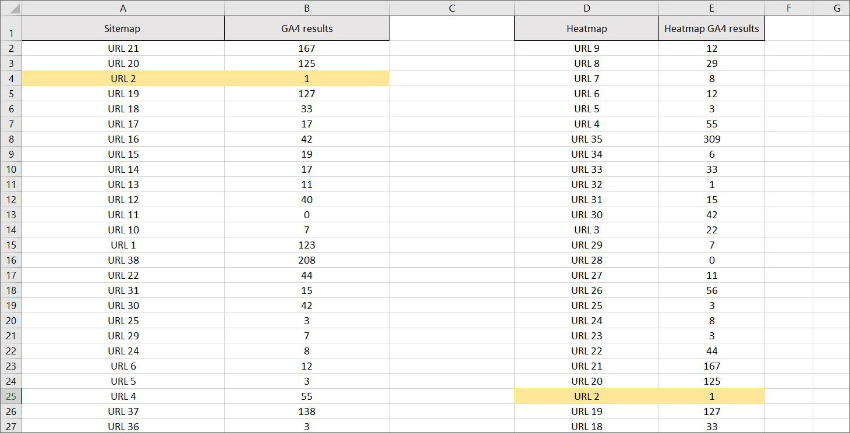
The new blog posts will be present somewhere in column A, but we want to add them to column D as well.
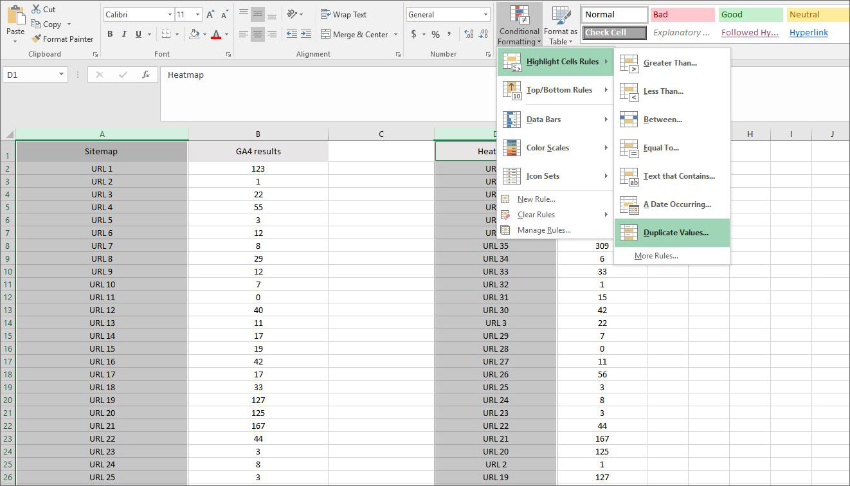
We can easily find them if we check the duplicate values of the columns A and D, and then simply look for those that were not marked as duplicates.
First, select these two columns and search for duplicates using the Conditional Formatting > Highlight Cells Rules > Duplicate Values option:
The duplicates in both columns will have red cells, while some of the cells in column A will remain transparent. These are your new blog posts, still not included in the Heatmap report.
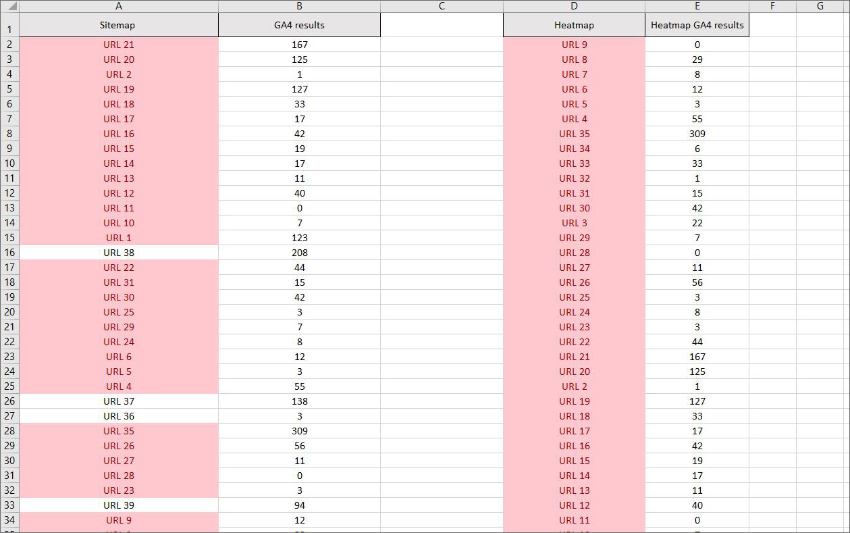
The last step is to collect them all, which can be done by applying a filter:
- Select column A
- Add the Filter (upper right corner, Sort & Filter option)
- Filter by Color
- No Fill
- Expand the selection
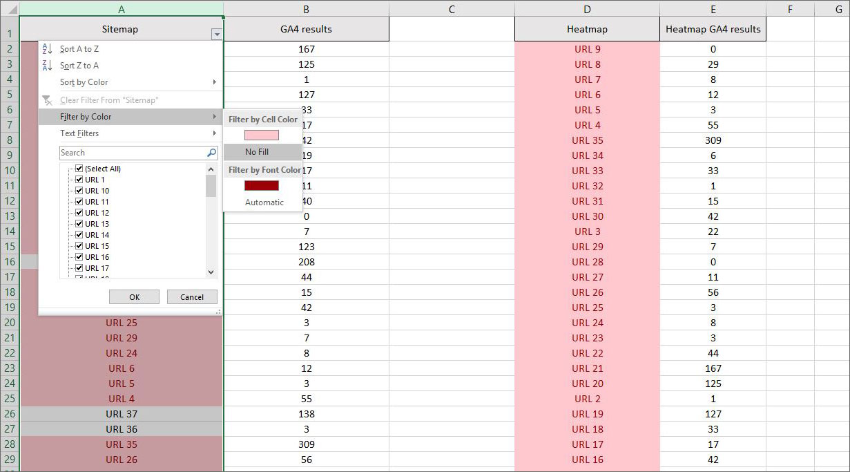
Here are the URLs that were not found in column D:
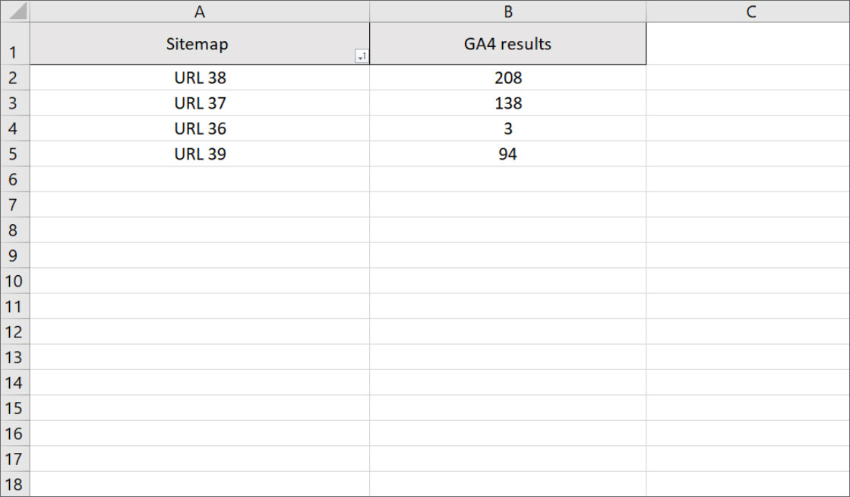
You can now copy them to column D and run an additional Duplicate check, if you want to make sure that all URLs are present in the Heatmap column (D).
Your heatmap list is now ready, so just add the values from the column E to your Google spreadsheet, and don’t forget to expand the list of spreadsheet’s URLs by adding the new blog posts from Excel’s column D.
The process is repeated each month. Don’t worry, you will become quicker over time, so it will probably take you around 20-30 minutes to add GA4 values for the new month after you get familiar with the process.
How to Use a Lexia Heatmap Report?
The heatmap reports are not a new thing in marketing. A lot of us have used various tools to determine where people click on our website, so we could optimize the pages for more conversions.
This heatmap is a bit different, because it’s based on a larger group of pages, values, and parameters.
It shows a trend of events that helps us determine winning and losing pages, for instance. If we see that certain blog posts are losing traffic over time, we can ask ourselves – why?
Maybe they need more internal links, a content rewrite, updated images and videos, meta tags update, etc.
On the other hand, we see that some pages are doing great. How to use them? Well, they can become a source of internal links to other pages that need a “push”. Or, we can promote those pages on social media and newsletters, and get even more positive results.
How about products?
We can use the Lexia Heatmap report there as well. If there are products that bring traffic, but no sales, maybe we can add a discount there. How about those that have low traffic, but sales are great? Include them into quality blog posts, prepare newsletters, and promote them on social media.
Combining several heatmap reports will give you an even better perspective. If you include GSC and Ahrefs, for example, you can see track clicks, impressions, positions, backlinks, and more.
Options are endless.
What do you think about Lexia Heatmaps? Let me know on LinkedIn, or contact me via our Lexia website.


Incredible publication! I will try to follow all the guidelines to generate this heatmap. Thanks for your work!
Wow top feature!
Thank you Miloš for a detailed post. I recently purchased the SEO spider license and tried to follow the guidelines. I hope I can do it properly as you wrote.