How Many Sites Pass the Core Web Vitals Assessment?
Richard Lawther
Posted 5 August, 2020 by Richard Lawther in SEO
How Many Sites Pass the Core Web Vitals Assessment?
Speed has long been an official ranking factor, but with the introduction of the Core Web Vitals (CWV), many an SEO might have noticed the ominous Pass/Fail assessment within PageSpeed Insights.

While these metrics aren’t yet used in Googles algorithm, I saw so many URLs failing, it got me wondering. How many well-ranking URLs end up passing the assessment?
2,500 keywords, 20,000 URLs, and just as many graphs later, I may have found the answer.

TL;DR – Across 20,000 URLs:
- Only 12% of Mobile and 13% of Desktop results passed the CWV assessment (i.e. considered good in all three metrics).
- First Input Delay (FID) on Desktop is negligible with 99% of URLs considered good. And 89% for Mobile.
- 43% of Mobile and 44% of Desktop URLs had a good Largest Contentful Paint (LCP).
- 46% of Mobile and 47% of Desktop URLs had a good Cumulative Layout Shift (CLS).
- URLs in Position 1 were 10% more likely to pass the CWV assessment than URLs in Position 9.
Methodology
As Core Web Vitals are evaluated on a per URL basis, I took 2,500 keywords across 100 different topics, scraping all the first-page organic results of each. In total I ended up with about 22,500 URLs. This was duplicated for both mobile and desktop results.
These where then run through the SEO Spider connected to the PageSpeed Insights API, gathering the necessary PSI & CrUX data.
A couple of caveats:
- All results were scraped from a search in Berkshire, UK.
- No rich result URLs where included.
- 10th position is excluded as so few SERPs had 10 organic listings, making the sample size considerably lower.
- A handful of results had featured snippets. These are classified as position 1 but may not be the ‘true’ 1st position.
- Some sites appeared across multiple rankings (e.g. Wikipedia)
- Several URLs could not be analysed in PSI for various reasons.
A Bit on Core Web Vitals
For anyone reading who might not be aware of Core Web Vitals – they’re three metrics Google will use to judge page experience. And will become an official ranking factor some time in 2021.
Why? To help push the web forward, encouraging site owners to provide better experiences for users – Aaaand likely helping Google to render the web a bit quicker and more efficiently at the same time. Win-Win.
They’re recorded using real user metrics (rUM) from the Chrome User Experience Report (CrUX). (Google search may also use lab data where CrUX is not available, but the analysis below focuses on rUM). PageSpeed Insights (PSI) then reports on the 75th percentile of this data (25% slowest loads), and classifies them by the following thresholds:

- Largest Contentful Paint (LCP): measures loading performance. To provide good user experience, LCP should occur within 2.5 seconds of when the page first starts loading.
- First Input Delay (FID): measures interactivity. To provide good user experience, pages should have an FID of less than 100 milliseconds.
- Cumulative Layout Shift (CLS): measures visual stability. To provide good user experience, pages should maintain a CLS of less than 0.1.
To pass the Core Web Vitals assessment, a URL needs to be considered ‘good’ in all three metrics.
What Did the Data Highlight?
As suspected only a small proportion of sites ended up passing the CWV assessment – shock! From our list of URLs, only 12% mobile and 13% desktop passed the CWV assessment.
Excluding those without rUM brought this to 23% and 24% respectively.
What’s more interesting is looking at individual pass rates for each ranking position:
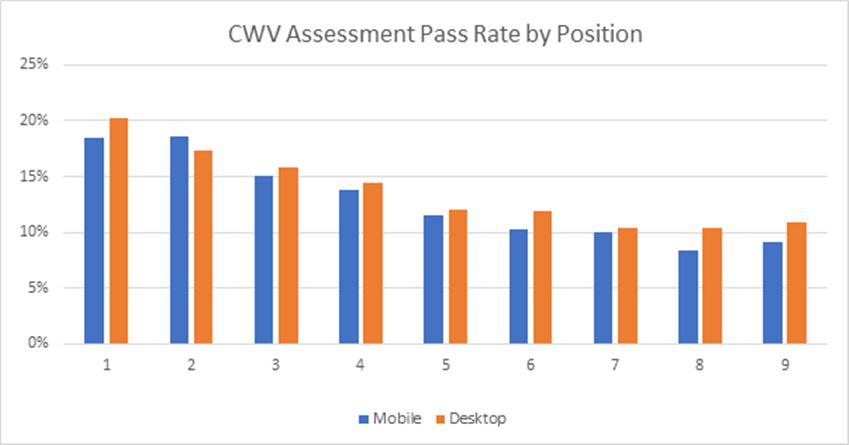
URLs in Position 1 had a pass rate of 19% on Mobile and 20% on Desktop. Moving from 1st to 5th saw a 2% decrease per position. The remaining results from 5-9 flattened out to a pass rate of around 10% on Mobile and 11% on Desktop.
So what’s going on here? Have CWVs been a top-secret ranking factor all along?
Very unlikely, but perhaps not far from the truth. From what I’ve noticed it tends to boil down to two aspects-
A major part of the CWV assessment focuses on load speed, which we know is already a ranking factor. Therefore, logic would suggest that quicker sites may rank slightly higher and end up passing the assessment in turn.
However, Google continually comments that speed is a minor factor. Instead, I suspect sites ranking in the first 1-4 positions tend to be better optimised overall. With targeted, rich, and user-friendly content. All while loading this information more efficiently.
Breaking Down the Vitals
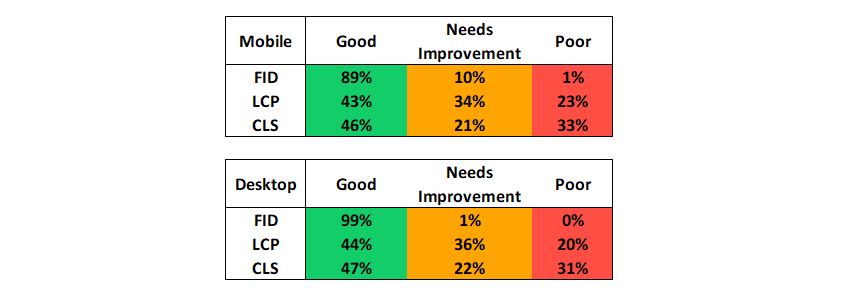
We can also view the individual metrics on a more granular level. The following table shows classification across the whole URL sample:
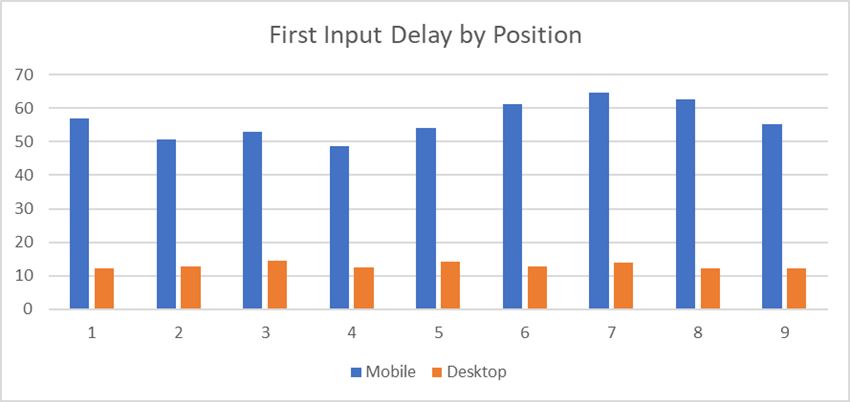
First Input Delay
The FID is negligible, with 89% of Mobile and 99% of Desktop URLs within the good threshold. Averaging at around 56ms on Mobile and 13ms on Desktop.
When comparing against position we get much less of a correlation:
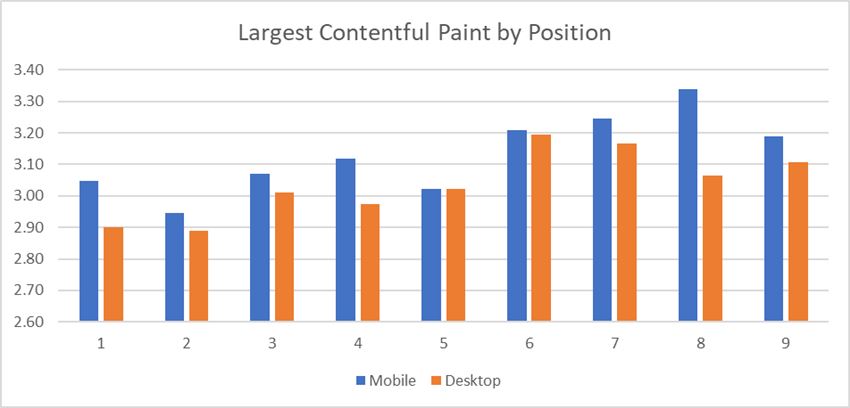
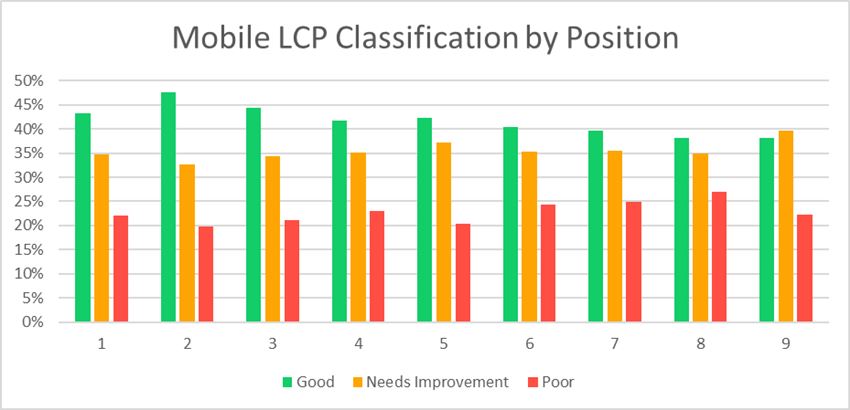
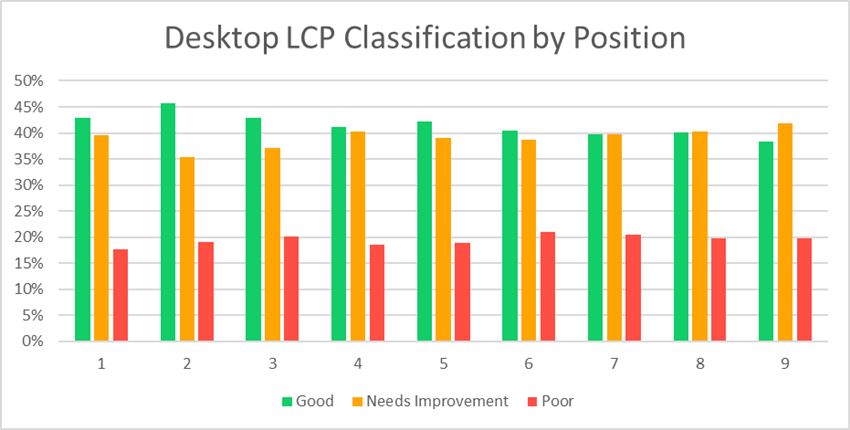
Largest Contentful Paint
LCP saw 43% of Mobile and 44% of Desktop URLs considered good. This averaged out at 3.13s for Mobile and 3.04s for Desktop.
When compared against position, we can see a slight trend. But only 0.14s difference between 1st and 9th:
We can also see this reflected in the pass rates (considered good) for each position:
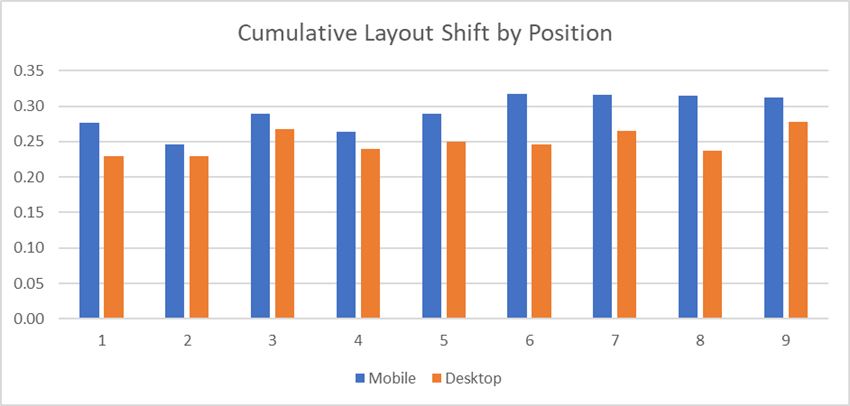
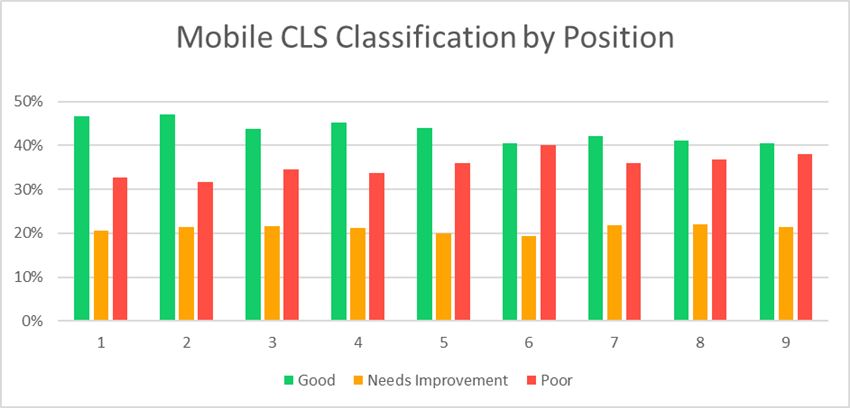
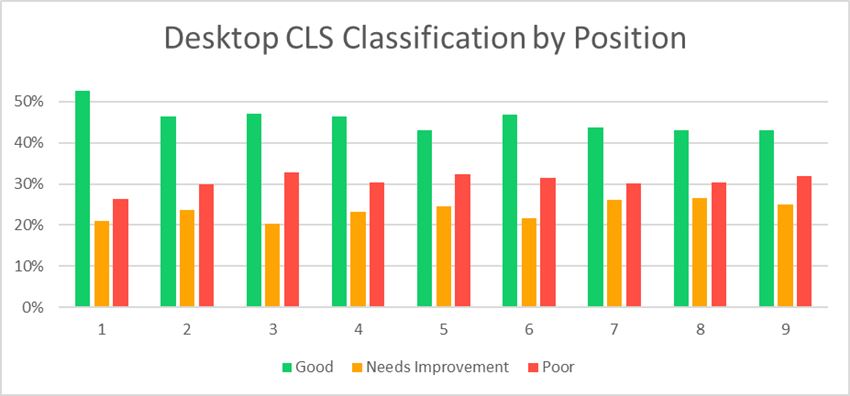
Cumulative Layout Shift
The CLS pass rates were much higher than I anticipated. As this is usually where we see most sites fail. CLS had 46% of Mobile and 47% of Desktop URLs considered good. This averaged at a CLS of 0.29 on Mobile and 0.25 on Desktop.
This also saw less of a correlation against position, though 1st and 2nd tended to be slightly lower:
When looking at individual pass rates by ranking, we can see a decline in the percentage of ‘good’ URLs as the position moves down the SERP.
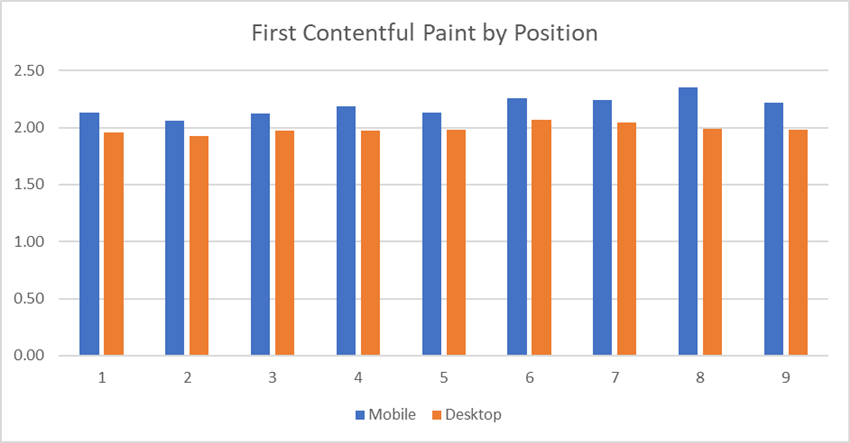
First Contentful Paint
Lastly, while it’s not a CWV I also extracted the FCP from CrUX data as another measure of speed. This saw an average of 2.19s on Mobile and 1.99s on Desktop.
While relatively unchanged on desktop, mobile saw a slight increase in load times by position. But only 0.10s between 1st & 9th:
What Can You Take Away from This?
Well, not a whole lot… (sorry). This is still a farily small sample, and Core Web Vitals are not an official ranking factor just yet and won’t be till 2021. Meaning their true impact is yet to be seen.
But if you do happen to load up PageSpeed Insights and see the disheartening ‘fail’ message. Fear not, you’re in good company with most other sites.
Will passing the assessment immediately boost your rankings? Probably not. Should you strive to pass it anyway? Definitely.
Regardless of how much ranking benefit speed and CWV’s provide, having your pages as quick, responsive, and stable as possible is great for users and search engines alike.
If you’re looking to make improvements, PageSpeed Insights is a great place to start. And you can easily grab data across your entire site with the SEO Spider and steps here.


Nicely done Richard! I’m going to send this to all the hosting companies I work with (and have worked with). Small businesses should not have to know what a Core Vital is and hosting companies should be more proactive to improve content delivery for their clients, or a bare minimum scan their clients’ websites and send them a monthly report and resources to help resolve issues beyond the host’s control.
A larger sample size is always appreciated for research impacting the entirety of the internet.
Completely agree – a larger sample would be useful. 20,000 fit nicely within the API limits but no reason you couldn’t run it across a wider group :-)
Thanks,
Richard
Cool post, thanks, feeling good within 19% haha. I think with larger sample size the situation is even worse.
Would make me think these new vitals are a step of Google trying to push AMP, what do you think?
On general i preffer Gtmetrix in terms of a feedback is much more handy to see what is going on on the webpage.
I am curious with the new vital LCP – it very much pushes videos out of the header, especially for mobile.
Thanks Kris :-) Yeah, it would be interesting to see if the trend continues across a larger sample. On AMP, part of me thinks so, but they’re also doing things like removing the amp requirement for top stories – so maybe not? GTMetrix is fantastic for analysing page speed, I use it quite often.
Hi Richard.,
First of all thanks a lot for detailed explaination about core web vital insights. I got few ideas from your post. Its been really helpful for our brand new site. We are facing the page load experience issue. Your ideas and inputs will help me out from this issue. Once again thanks! Keep writing and inspring!
How much will Google downgrade sites that have not achieved good results in site load speed?
In my experience, not a lot, unless your site has some ludicrous loading times. However, there are tons of UX factors and benefits for having a speedy site to consider. So it’s definitely worth improving load times regardless of any direct ranking benefit.
Hi Richard,
well done!!! so interesting post.
Thanks
Hi Richard
Over the previous 28-day collection period, the aggregate experience of all pages served from this origin does not pass the
how can i become
Origin SummaryOver the previous 28-day collection period, the aggregate experience of all pages served from this origin passes the Core Web Vitals assessment
If you have any ads on your site, it’s unlikely you’ll pass. My site is stripped down and as lean as can be, but I don’t pass. On Page Speed Insights, most of my mobile pages are over 80 and desktop are near 100. I still don’t pass.
The only way you can have your cake and eat it too is if you do your own ad brokering. You’d have to put up simple, static ads with compressed images. If you’re going through a service like AdSense, Media.net or Ezoic, you won’t pass. Yes, Google owns AdSense. AdSense and Search are two different business units. Google isn’t a monolith.
From what I understand, page speed actually has a very weak SEO effect. Google officials have said this repeatedly.
Page speed is more likely a non-issue in the future, as networks speed up.
We have ads on and pass both desktop and mobile core web vitals on our content pages, which are filled with media. It takes significant engineering effort. Without ads, it’s much easier, but lots of things can still keep websites from scoring well, especially templated websites bloated with plugins. Don’t show any above the fold ads and lazy load the rest, then you have a chance.
There’s also the option of going the AMP route. I believe Google will consider any AMP page that passes validation to automatically beat core web vitals, as AMP pages loaded from Google AMP Cache are virtually instant-load (not those loaded from your server though).
Yes, of course, better configuration yields a faster website. I wouldn’t call it engineering, but configuration. It’s more of a sysadmin’s realm than a software engineer’s. I say this as someone who has written over a million lines of Java code. Fiddling with WordPress is much easier than WebSphere or any Java EE app server.
You don’t need a software engineer to performance-tune WordPress. Many hosts offer tools enabling less technically inclined people to achieve excellent performance. Make a backup, make the suggested changes, and see if there’s an improvement.
If two sites have the same configuration and one has ads, the latter will be slower. Ads use a lot of JavaScript and assets, dramatically increasing page load. One can defer JavaScript or make it asynchronous, but it will usually cause problems with a site’s performance tests.
One of the reasons why advertising JavaScript slows down sites is because it tends to involve a lot of spyware. Front-end JavaScript must call various servers to show relevant ads based on user preferences. Where is the user? What are they interested in? Oh, they have a dog? Let’s show a dog food ad. Oh, they’re in the EU? Show a cookie consent banner and all the other paranoid-placating content.
Sites often cut out beneficial code to accommodate ads. It’s a shame because web developers, including myself, are cutting out the dynamic functionality that makes websites more like apps. The site I have now is like something from the late 90s. It shouldn’t be this way, but this is the harm Google caused through sloppy action. They made the web a boring place — much worse than it was 15-20 years ago.
There’s another wrinkle to CWVs: the entire scheme appears to be rigged. In December, I moved to a new host and obtained perfect performance scores in PageSpeed Insights tests. After months, the Core Web Vitals still failed. I moved to a dedicated server with 80+ CDN PoP’s. The CDNs cache the entire web page, not just assets. The site still failed CWVs, despite perfect scores in the assessment and with every other page speed test. These failing scores persisted for months despite running one of the fastest sites in the world by every other performance test.
I made a big stink about this and complained to the FTC. Within a few days, I passed all Core Web Vitals tests. I have some theories as to why this happened, but it has little to do with our site’s configuration and performance.
Google placed a big black box around the Internet and play with it as if they own it. One thing that’s abundantly clear — the rules don’t apply to certain large, established corporate websites. You can do whatever you want if you’re The Verge, The New York Times, CNN.com, etc.
One thing I found very fishy — you look at some of these corporate sites and they pass both CWVs, but their performance in the real-time assessment is horrible. Test their pages in a third-party tool, and it’s clear they’re horrible.
Thus, CWVs seem to work against independent publishers and in favor of prominent corporate publications. It’s what you’d expect from Google. It’s like a way to rationalize the irrational.
AMP is a disaster. It’s not fast, and it makes web pages ugly. It’s yet another bad idea from Google. You may fall for the AMP trap if you’re still brainwashed into believing Google cares about independent publishers. It seems like another way for Google to level the playing field for their cronies who operate slow websites crammed with advertisements (many of which are served by Google).
Do no evil? Yeah, right… Organizing the world’s information to make it universally accessible and useful? To whom? For whom?
Google took over a public network of computers. This isn’t Facebook. We pay a lot to host our sites. We put a lot of work into our sites. Now, they’re using it to favor cronies more than ever.
GOOGLE KILLED SEARCH NEUTRALITY.
As far as robber barons go, Google is the worst. Even Leland Stanford bought the farms and railroads. Google just took over the web and rearranged it for billionaires’ benefit. Even Leland Stanford would think it’s creepy AF.
The whole point of the WWW was that experts could communicate directly with the public without corporate moderation. Google killed this. For example, most top-ranking articles about anything technical or scientific are written by laypeople with English degrees who work for large corporate publications. That’s what Google considers an authority.
When I look at our most competitive searches, where we once ranked first, they’re now dominated by misinformation because Google derives authority from corporation size, branding, and status, not from any measure of expertise. They cannot ascertain knowledge and authority because their AI initiatives are parlor tricks.
Authority for Google is a mashup of a popularity contest and brand ranking. The company cannot detect authority, correctness, misinformation, or any fraction of intellect, but they pretend that’s how it all works.
Surprise! Silicon Valley is full of BS artists, and Google is no exception.
excellent post congratulations. After battling for a long time with corevitals, I recognize that there are many websites that do not exceed the expected metrics. This post helps to have a more detailed view
Great post!!! Thanks.
It seems like Core Web Vital will be really important this year and I’m already working on it.
Regards.
These indicators are not new. Many of them were already recommended by Google during the first versions of PageSpeed Insights. However, indicators and their entry into the search engine algorithm are a good reason to take a closer look at your websites and actually make changes that will make it easier to use the websites. As long as the alert in Search Console does not adversely affect search results, it is worth considering how important from a UX point of view the problem you are reporting is.
I was writing a blog post about the upcoming Google Page Experience update, and came across this article afterwards. Really interesting, and really does show how worthwhile it is to improve your website to achieve a ‘good’ for each of the 3 CWV tests. I’ve been banging on about the need to improve user experience for years. It is a little frustrating that many people only sit up and take notice when Google say it’s important.
I’m guessing you don’t mind me linking to your article from my blog post :)
Optimizing for quality of “user experience” is key to the long-term success of any site on the web. Whether you’re a business owner, marketer, or developer, Web Vitals can help you quantify the experience of your site & identify opportunities to improve.
Cheers :)
We did a comparison for a sample of online stores in Poland and it didn’t show that updating Core Web Vitals significantly affected SERP position. It didn’t seem to affect the metrics in Page Speed Insights either. This is quite puzzling.
Great post!!! Thank you.
Core Web Vital is being really important to rank in Google, I am already working on it. It’s also true that it’s not that important until you have some traffic.
Greetings.
Have you folks done anything like this more recently? I would be very surprised if a lot more domains were not passing on the Core Web Vitals by 2024…