Reviving Retired Search Console Reports
Richard Lawther
Posted 8 April, 2019 by Richard Lawther in SEO
Reviving Retired Search Console Reports
Since I started my journey in the world of SEO, the old Google Search Console (GSC) has been a mainstay of every campaign I’ve worked on. Together, we’ve dealt with some horrific JavaScript issues, tackled woeful hreflang implementation, and watched site performance reach its highest highs and lowest lows.
Sadly, all good things must come to an end, and in Jan ’19 Google announced most of the old Search Console features would be shut down for good at the end of March.
But it’s not all doom and gloom. As a successor, we now have an updated Google Search Console v2.0 to guide us into the modern web. This new console has a fresh coat of paint, is packed with new reports, gives us 16 months of data, and provides a live link straight into Google’s index — it’s all rather lovely stuff!
Despite all this… I still can’t help looking longingly for a few of the old reports sitting neatly tiered on the left-hand side of the browser.

While we can’t quite turn back time, using the trusty SEO Spider we can replicate a few of these reports to fill the void for tabs now deleted or yet to be transferred over. Before jumping in, I should note this post mostly covers reports deleted or not fully transferred or across. If you can’t find something here, chances are it’s already available on GSC 2.0.
Structured Data
The new GSC does indeed have some structured data auditing in the new ‘Enhancements’ tab. However, it only monitors a few select forms of structured data (like Products and Events markup etc…). While I’m sure Google intends to expand this to cover all supported features, it doesn’t quite meet the comprehensiveness of the old report.

Well, hot on the heels of the v11.0 release for the SEO Spider, we now have bulk structured data auditing and validation built in. To activate, just head over to Configuration > Spider > Advanced > Enable the various structured data settings shown here:

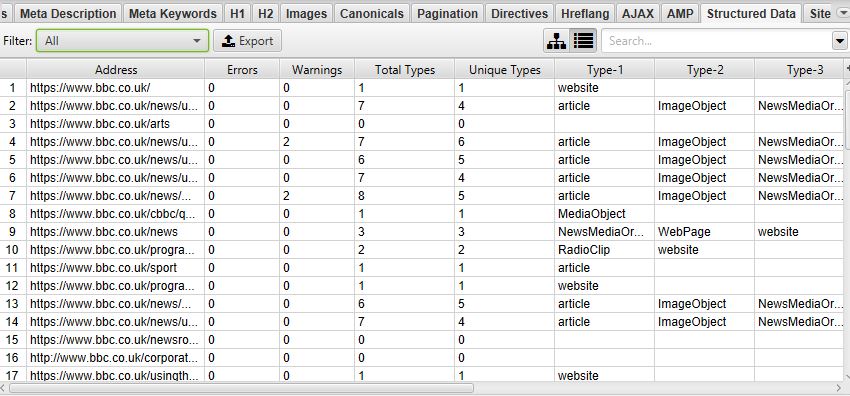
Once your crawl is complete, there are two areas to view structured data. The first of which is in the main Structured Data tab and various sub filters, here:
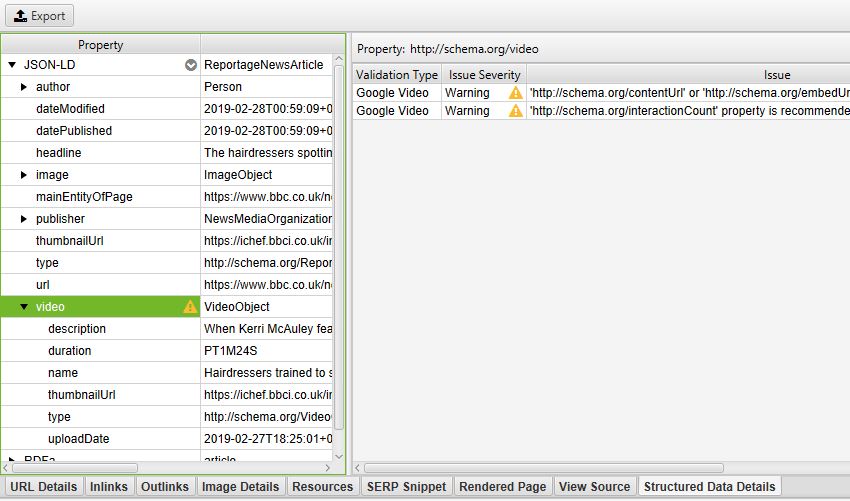
Or, if you just want to examine one lone URL, click on it and open the Structured Data Details tab at the bottom of the tool:
There are also two exportable reports found in the main report’s menu: the Validation Errors & Warnings Summary, and the Validation Errors and Warnings.
For the full details, have a look at:
https://www.screamingfrog.co.uk/seo-spider/user-guide/tabs/#structured-data
HTML Improvements
The HTML Improvements was a neat little tab Google used to show off errors with page titles, meta descriptions, and non-indexable content. Mainly it highlighted when they were missing, duplicated, short, long, or non-informative.
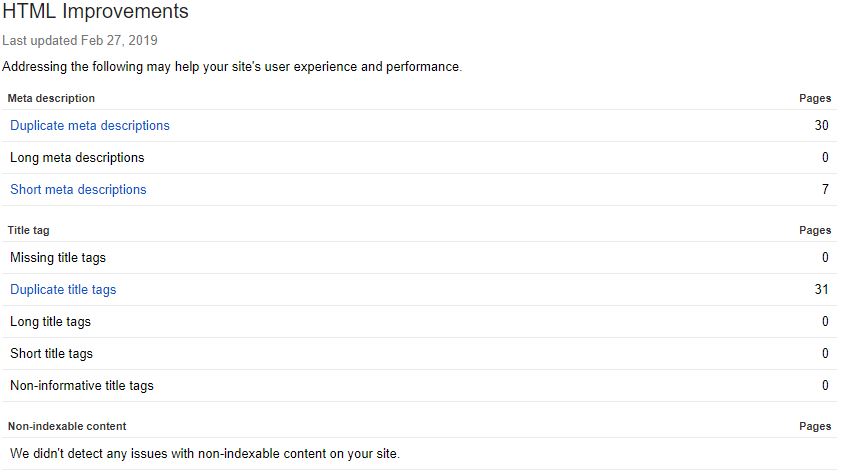
Unlike many other reports, rather than transferring over to the new GSC it’s been completely removed. Despite this, it’s still an incredibly important aspect of page alignment, and in Google’s own words: “there are some really good tools that help you to crawl your website to extract titles & descriptions too.” Well — taking their hint, we can use the Spider and various tabs or filters for exactly that.
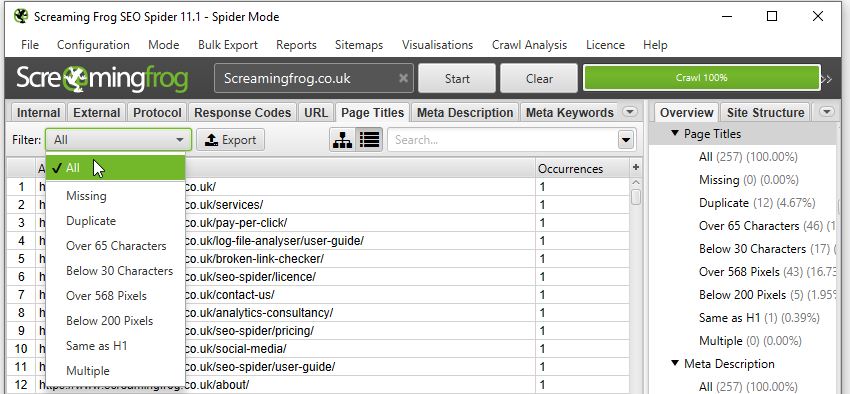
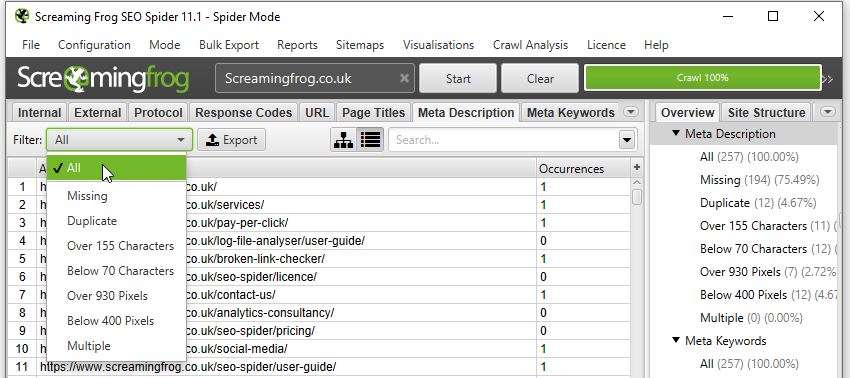
Want page title improvements? Look no further than the filters on the Page Title tab:
Or if you’re curious about your Meta Descriptions:
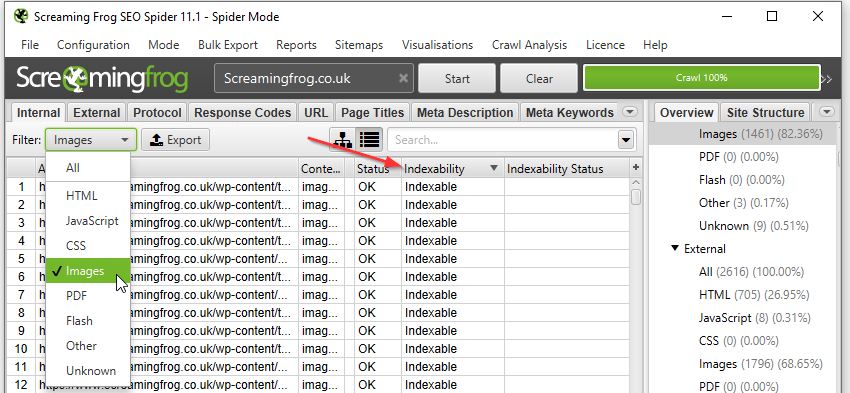
Want to see if any pages reference non-indexable content? Just sort by the Indexability column on any tab/filter combo:
International Targeting
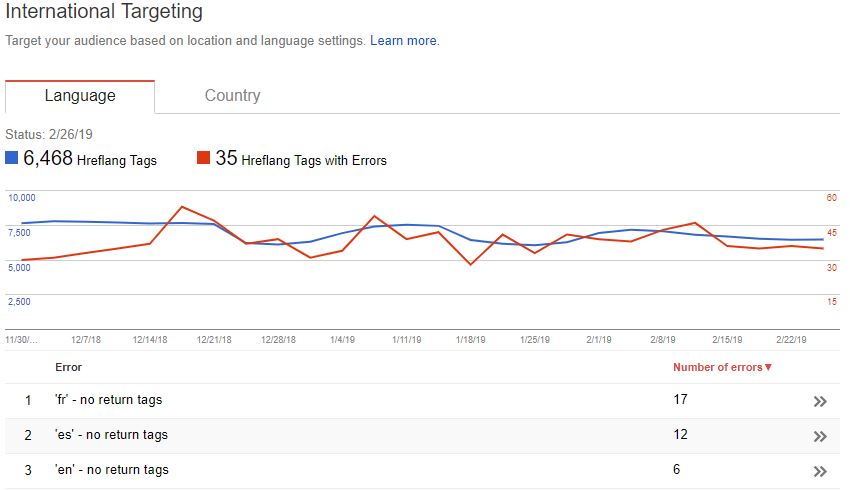
Ahh, hreflang… the stuff of nightmares for even the most skilled of SEO veterans. Despite this, correctly configuring a multi-region/language domain is crucial. It not only ensures each user is served the relevant version, but also helps avoid any larger site or content issues. Thankfully, we’ve had this handy Search Console tab to help report any issues or errors with implementation:
Google hasn’t announced the removal of this report, and no doubt it will soon be viewable within the new GSC. However, if for any reason they don’t include it, or if it takes a while longer to migrate across, then look no further than the hreflang tab of the SEO Spider (once enabled in Configuration > Spider > hreflang).
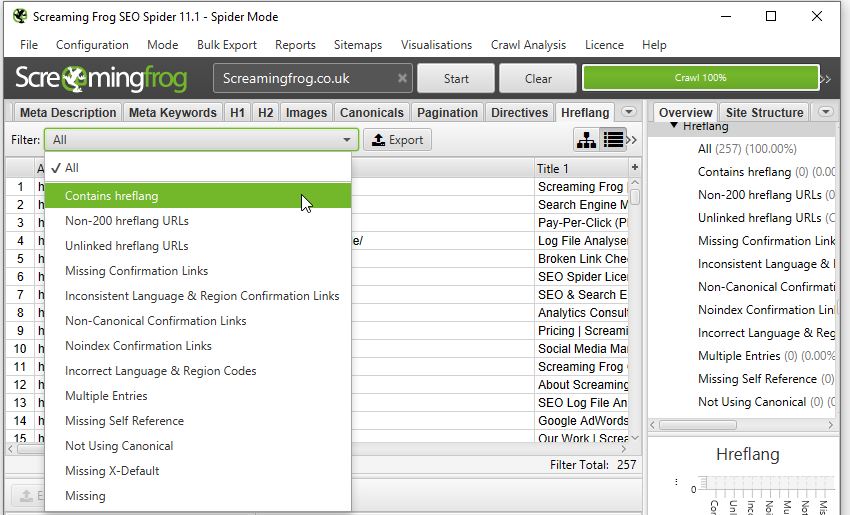
With detailed filters to explore every nook and cranny of hreflang implementation — no matter what issues your site faces, you’ll be able to make actionable recommendations to bridge the language gap.
There’s also a handful of exportable hreflang reports from the top ‘Reports’ dropdown. While I won’t go through each tab here, I’d recommend you check out the following link which explains everything involving hreflang and the spider in much more detail:
https://www.screamingfrog.co.uk/seo-spider/tutorials/how-to-audit-hreflang/
Blocked Resources
Another report that’s been axed — it was introduced as a way to keep track of any CSS or JavaScript files being blocked to search bots. Helping flag anything which might break the rendering, make the domain uncrawlable, or just straight up slow it down.
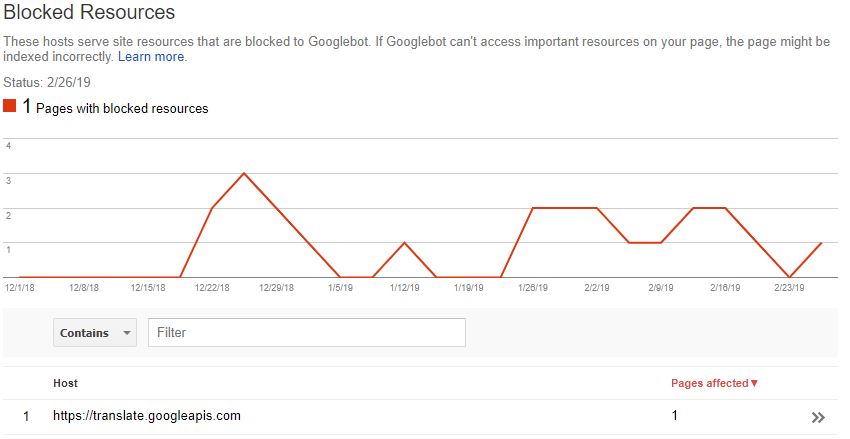
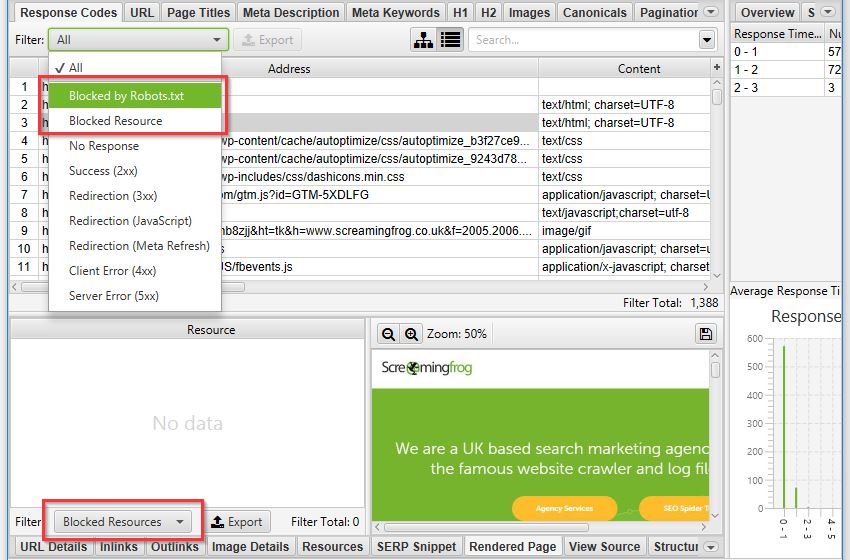
While these issues have drastically decreased over the years, they’re still important to keep track of. Fortunately, after running a crawl as Googlebot (Configuration > User-Agent > Googlebot) we can find all blocked resources within the Response Codes tab of the Spider — or if you’re just looking for issues relating to rendering, have a look at the bottom Rendered Page details tab:
Fetch as Google
“But wait — you can just use the new URL inspect tool…”. Well, yes — you can indeed use the new URL inspect to get a live render straight from Googlebot. But I still have a few quarrels with this.
For a start, you can only view your render from Googlebot mobile, while poor desktop is completely neglected. Secondly, the render is just a static above-the-fold screenshot, rather than the full-page scrollable view we used to get in Fetch As.
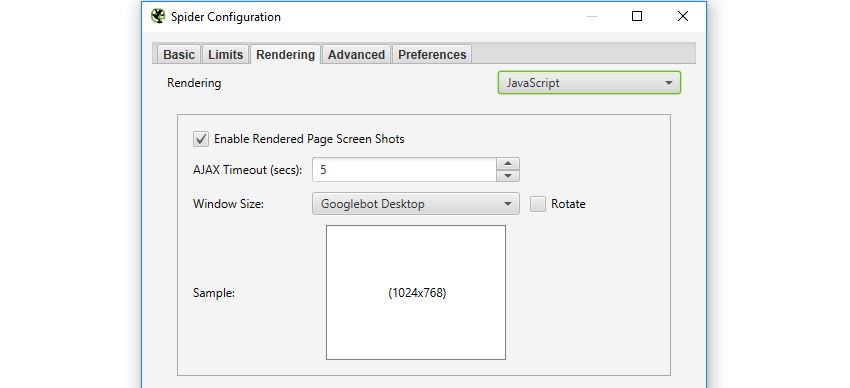
While it’s not quite the same as a direct request from Google, we can still emulate this within the Spider’s JavaScript rendering feature. To enable JavaScript rendering head over to Configuration > Spider > Rendering and switch the drop down to JavaScript.
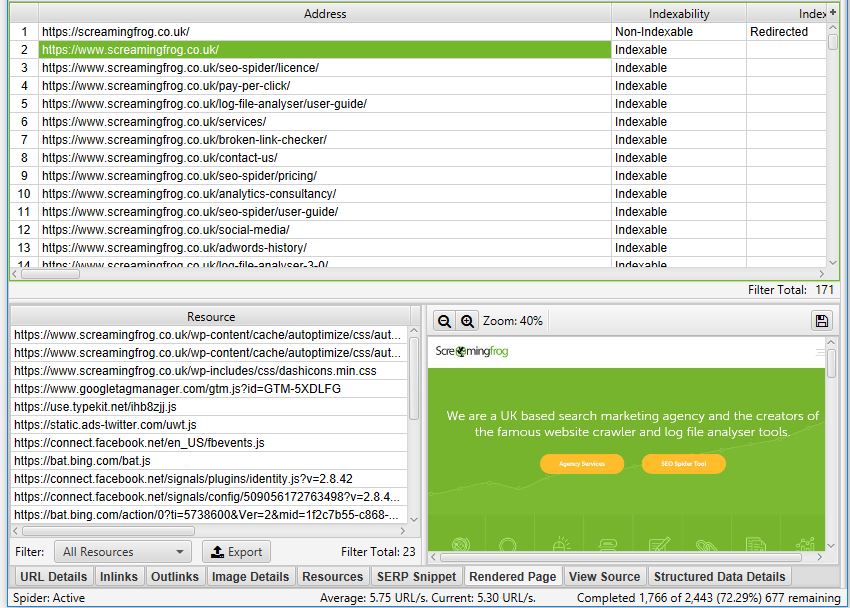
Once your crawl is complete, highlight a URL and head over to the Rendered Page tab towards the bottom. Here you can view (or export) a screenshot of your rendered page, alongside a list showing all the resources needed:
If you want to mimic Google as much as possible, try switching the User-Agent to Googlebot or Googlebot mobile (Configuration > User-Agent). This will make the Spider spoof a request as if it were Google making it.
It’s also worth mentioning that Googlebot renders JavaScript based on v41 of Chrome, whereas the Spider uses the updated v64 of Chromium. While there aren’t many massive differences between the two, there may be some discrepancies.
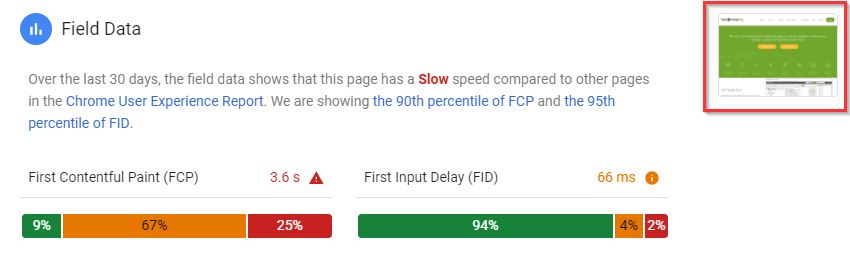
As a bonus, if you still want a desktop render direct from Google (or don’t have access to Search Console of a domain), the PageSpeed Insights tool still produces a static desktop image as a representation of how Googlebot is rendering a page. It’s not the most high-res or detailed image but will get the job done!
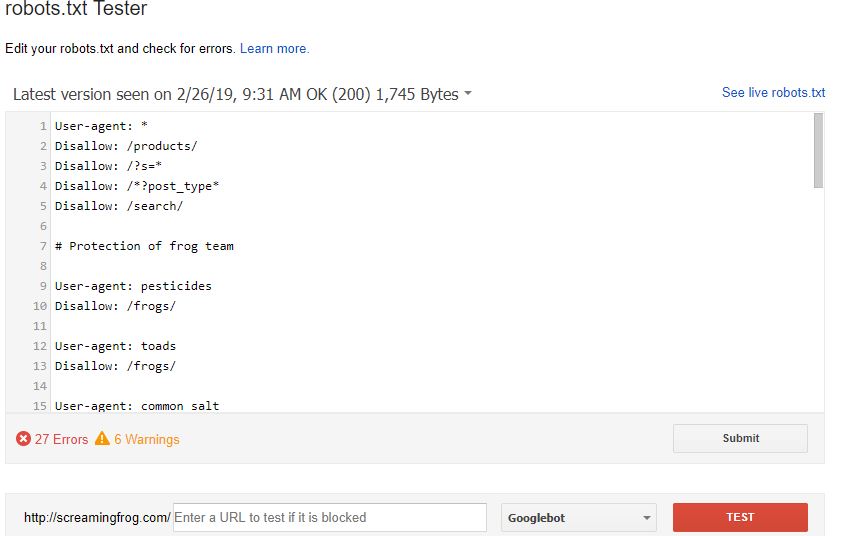
Robots.txt tester
Another tab I’m hopeful Google will eventually migrate over — testing your robots before submitting is crucial to avoid disallowing or blocking half your site to search engines.
If for any reason they don’t happen to transfer this across to the new GSC, you can easily test any robot’s configuration directly within the SEO Spider (Configuration > Robots.txt > Custom).
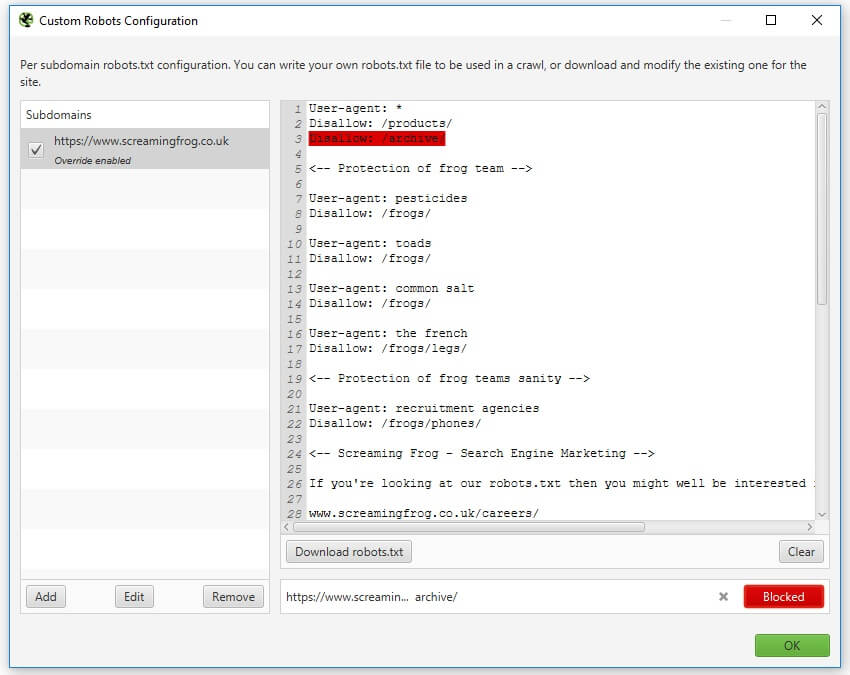
This window will allow you to either import a live robots.txt file or make your own custom one. You can test if an individual URL is blocked by entering it into the search at the bottom. Alternatively, run a crawl of your site and the spider will obey the custom crawl behaviour.
For a much more in-depth guide on all the robots.txt capabilities of the SEO Spider, look here:
https://www.screamingfrog.co.uk/seo-spider/tutorials/robots-txt-tester/
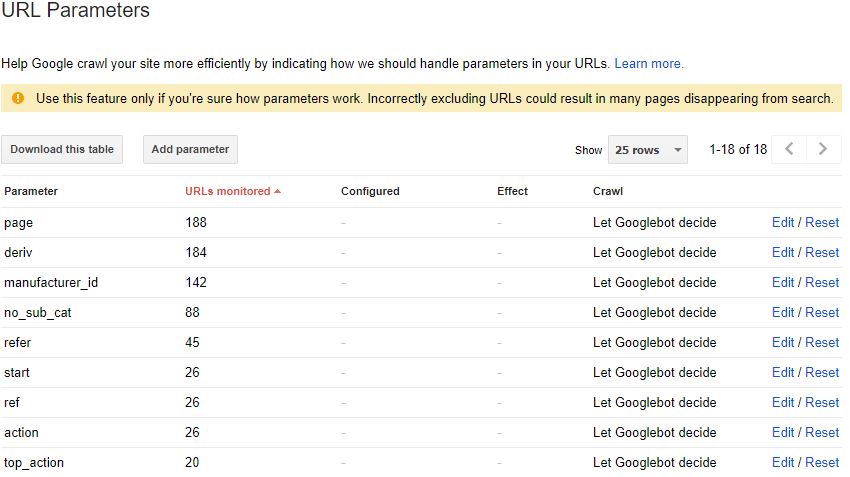
URL Parameters
An extremely useful tab — the URL Parameters helps to highlight all of the various parameter queries Google found on its journey through your site. This is particularly useful when examining the crawl efficiency or dealing with faceted navigations.
Currently, there’s no way of replicating this report within the Spider, but we are able to get a similar sample from a crawl and some Excel tinkering.
Just follow these steps or download the macro (linked below) –
1. Run a crawl of the domain, export the internal HTML tab
2. Cut & Paste the URL list into Column A of a fresh Excel sheet
3. Highlight Column A > Data > Text-to-Columns > Delimited > Other: ? > Finish
4. Highlight Column B > Data > Text-to-Columns > Delimited > Other: & > Finish
5. Highlight Column A > Right-click > Delete
6. Home > Editing > Find & Select > Go to Special > Blanks > OK
7. With these highlighted > Home > Cells > Delete
8. CTRL+A to highlight everything > Find & Replace > Replace: =* with nothing
9. Stack all columns into one & add a heading of ‘Parameter’
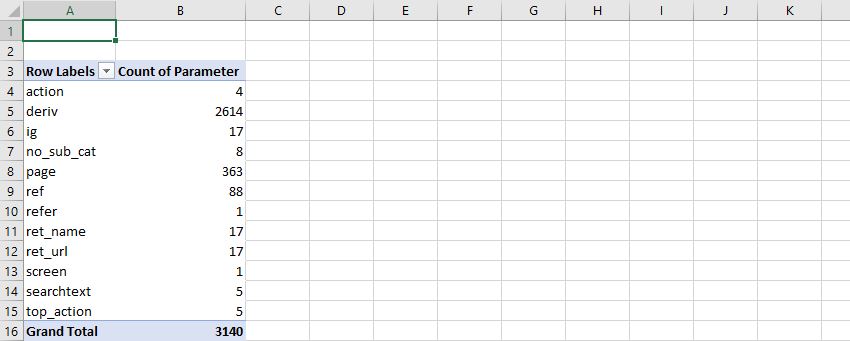
10. Highlight this master column > Insert > Pivot Table > Recommended > Count of Parameter
To save some time, I’ve made an Excel macro to do this all for you, which you can download here. Just download the spreadsheet > click Enable Content & Enable Editing then follow the instructions.
If everything’s done correctly, you should end up with a new table similar to this:
It’s worth noting there will be some discrepancies between this and Google’s own URL report. This boils down to the fundamental differences between the Spider & Googlebot, most of which is explained in much greater detail here:
https://www.screamingfrog.co.uk/seo-spider/faq/#why-does-the-number-of-urls-crawled-not-match-the-number-of-results-indexed-in-google-or-errors-reported-within-google-webmaster-tools
The King Is Dead, Long Live the King!
Well, that’s all for now — hopefully you find some of these reports useful. If you want a full list of our other how-to guides, take a look through our user guide & FAQ pages. Alternatively, if you have any other suggestions and alternatives to the retired Google system, I’d love to hear about them in the comments below.
As a side note: for many of these reports, you can also combine them with the Scheduling feature to keep them running on a regular basis. Or, if you’d like some automatic reporting, take a quick look at setting this up in the Crawl Reporting in Google Data Studio of my previous post.


I will try to implement the count of parameters right now! Very useful.
I don’t like the new google search console interface. Anyway, thanks for your suggestions, I will keep this in mind
I think they are adding some old reports one by one. A couple of days before they added “Sitelinks Searchbox” and “Logos” under enhancement tabs. Hope, other old reports will also be available on new GSC.
Excellent. I was actually looking for a way to get those reports as the new interface is a bit confusing at times. Thank you!
Thank you! Very helpful :)
I do not like the new GSC interface too. I also hope that the old reports will be available again. In the meantime, thanks for this new way to create report. I don’t have any other suggestions and alternatives for now. I will do some research.
Great post! The new GSC interface still needs a lot of tweaking. As for the old reports, I hope they make it available again. I myself use Screaming Frog for my reports and onsite/technical auditing. Thanks!
In my company, we are using this tool from past 3years. Most of our clients are always happy with reports and data. I would like to thank you for Screaming Frog. Nice article and do you provide API extension too?
Hey Mandeep,
We appreciate the kind words. Please see our FAQ here on the query about the API – https://www.screamingfrog.co.uk/seo-spider/faq/#do-you-have-an-api
Cheers.
Dan
Very helpful, thank you so much!
Thanks for the information, Richard – very interesting to know what can be done with a little bit of extra work!
It’s definitely sad that the old search console has gone though. Personally, my favourite feature was the Structred Data helper – I just can’t get on with the new one :(
Keep up the good work anyway, hope to see some new features from you guys soon.
Really great post here, I’m sure this will be tremendously helpful for folks! Still sore about losing those features but glad you guys are thinking about bridging that gap.
Loving the new structured data testing in bulk, so tedious doing it one by one – this will save us a heap of time, excellent as always guys!
I love the new google search console. It’s my opinion. Thanks
Thank you for the deep information and tips here. I have used screaming frog for more basic analysis, but I will definitely keep this post aside as a reference as great knowledge here. thanks again.