Flying Blind: Measuring Keyword Coverage on a Cluster Without First-Party Tools
Adriano Maggi
Posted 6 October, 2025 by Adriano Maggi in Screaming Frog SEO Spider
Flying Blind: Measuring Keyword Coverage on a Cluster Without First-Party Tools
Most SEO audits today lean heavily on data from Google Search Console (or BigQuery), performance dashboards, or SEO suites. But what if you’re flying blind?
This happens more often than you’d think:
- You’re onboarding a new prospect and they haven’t granted access yet.
- You’re reviewing a competitor site or a marketplace you don’t own.
- You’re asked to deliver quick strategic insights with limited access.
In these cases, we need to simulate a keyword coverage audit using only public tools and crawling software.
This is exactly what this workflow enables: a top-down clustering process based on Google Keyword Planner data, Screaming Frog SEO Spider crawls, and a bit of custom JavaScript.
The outcome?
A clear snapshot of:
- What each page should be targeting
- How well it’s currently aligned
- Which queries are missing from core elements
- What traffic opportunity is being left on the table
No verified data? No problem, you can still make informed decisions.
This article is a guest contribution from Adriano Maggi, SEO Team Leader at WMR Group.
The 5-Step Framework
1. Define Keyword Clusters and Map Them to URLs
Before writing a single line of code or launching your crawl, take a step back. Ask yourself:
What should each page be ranking for?
Start with Google Keyword Planner (or any keyword tool that gives you monthly search volume and query ideas). Build semantic clusters by grouping together keywords that belong to the same intent or subtopic. Try to avoid mixing too many intent types and keep the clusters tight and focused.
For this task, leveraging AI can do the heavy lifting. While AI tools aren’t perfect at fully automating clustering, if you perform a quick keyword research and clearly define search intents, you can quickly associate keywords to clusters using a well-crafted prompt or a easy/medium Python script. But hey, that’s a post for another day!
Finally, associate each cluster to a single canonical URL. This will be your target page, or in other words, the one that should comprehensively cover the cluster’s topics.
Example:
/farmaci.html → ["over the counter drugs", "otc medicine", "non-prescription drugs", etc.]

This mapping becomes your reference matrix: it tells the Screaming Frog SEO Spider what to look for and helps you calculate coverage later.
2. Use the Screaming Frog SEO Spider & Custom JavaScript to Check Coverage
Once your keyword clusters are mapped to URLs, it’s time to test how well each page actually reflects its target queries.
The Screaming Frog SEO Spider allows you to run custom JavaScript extractors, a powerful but often overlooked feature. Instead of extracting static data (like meta descriptions or canonical tags), you can write a script in which you insert your defined keyword list and check whether those terms are present in the title, H1, meta description, and body content of the target URL.
This essentially turns the SEO Spider into a basic content audit engine, one that compares intent (your cluster) with reality (the actual on-page elements).
- Reads the Associated Keyword Cluster
- The cluster is manually embedded in the script based on the page URL (e.g., if URL contains /farmaci.html, associate it with a predefined list of queries like ["farmaci otc", "farmaci senza ricetta", …]).
- Scans Core Page Elements
- The script parses the title, H1, meta description, and body text from the live rendered HTML. It then checks each keyword from the cluster to see if it appears in any of those elements.
- Calculates Keyword Coverage
- It returns the percentage of keywords from the cluster that are actually used in the page. For example, if 4 out of 10 keywords are found, that’s a 40% coverage.
- Lists Missing Keyword:
- It also returns a list of keywords that weren’t found, helping you immediately spot what’s missing from the page and where you may need to enrich content.
In your Screaming Frog export, you’ll end up with two useful columns: Keyword Coverage % and Missing Keywords.
These fields give you a quantifiable, actionable view of how aligned your content is with the topic it’s supposed to rank for, even without looking at traffic or performance data.
The beauty of this easy and basic method is that it scales easily with as many keywords as you want. And that’s crucial, because modern SEO is less about single-keyword targeting and more about ensuring full coverage across entire semantic clusters.
A query coverage check tries to reflect this shift. It moves us beyond the idea of optimising for individual queries and toward evaluating how well a page covers a broader search entity — a thematic topic that may span multiple SERPs and intents.
This approach gives you a fast, structured way to assess the on-page optimisation quality of the key pages in any domain. It is especially useful when you’re seeing a site for the first time during an audit or consulting project. By defining the keyword cluster yourself, you also control what kind of intent you’re analysing. You may focus on high-converting transactional terms, long-tail informational ones, or a mix – depending on your goals.
Ultimately, you decide whether to stick to exact-match phrasing or to simulate a broader query fan-out – something that Screaming Frog can support as well.
Below is the anonymised version of the custom JavaScript snippet used in this specific workflow example.
const url = window.location.href.toLowerCase();
const title = document.querySelector("title")?.innerText.toLowerCase() || "";
const h1 = document.querySelector("h1")?.innerText.toLowerCase() || "";
const meta = document.querySelector("meta[name='description']")?.content.toLowerCase() || "";
const body = document.body?.innerText.toLowerCase() || "";

let cluster = [];

// URLMapping > keyword cluster
if (url.includes("/farmaci.html")) {
  cluster = [
    "farmaci senza ricetta",
    "farmaci otc",
    "farmaci sop",
    "medicinali da banco",
    "farmaci online senza ricetta",
    "farmaci over the counter",
    "medicinali senza ricetta"
  ];
} else if (url === "https://yoursite.it/" || url.endsWith("/")) {
  cluster = [
    "farmacie online",
    "farmacia online miglior prezzo",
    "migliore farmacia online",
    "farmacia online più conveniente",
    "farmacie online autorizzate",
    "farmacie online sicure",
    "farmacie online affidabili",
    "farmacia online prezzi bassi",
    "farmacia online sicura",
    "farmacie online con pagamento alla consegna",
    "farmacia on line senza spese di spedizione"
  ];
}

let matchedCount = 0;
cluster.forEach(kw => {
  const lowerKw = kw.toLowerCase();
  if (
    title.includes(lowerKw) ||
    h1.includes(lowerKw) ||
    meta.includes(lowerKw) ||
    body.includes(lowerKw)
  ) {
    matchedCount++;
  }
});

const total = cluster.length;
const percentage = total > 0 ? Math.round((matchedCount / total) * 100) : 0;

return seoSpider.data({
  "Keyword Coverage": `${matchedCount}/${total} (${percentage}%)`
});
3. Enrich the Dataset with Keyword Volumes in Google Sheets
Once you’ve assessed keyword coverage on-page, the next logical step is to measure the potential impact of what’s missing.
Coverage alone tells you what is present or absent, but not how much it matters. Without traffic or performance data from Search Console, the most practical proxy for business opportunity is search volume. That’s where Google Keyword Planner comes into play: it provides the quantitative layer needed to prioritise gaps.
By enriching your dataset with monthly search volumes, you can begin to frame missing keywords not just as oversights, but as lost potential. This step brings you closer to understanding the real cost of poor alignment, helping you make smarter decisions when optimising or rewriting content.
Combine Coverage with Volume Data
To quantify how much value you’re leaving on the table:
- Go Back to Google Keyword Planner
- Use the same keyword list you clustered earlier. Download the monthly search volume data for each keyword. This gives you an objective sense of demand per query.
- Prepare the Data in Sheets
- Clean and organise your keyword list with corresponding volumes in a separate tab of your Google Sheet.
- Match Volumes to Screaming Frog Output
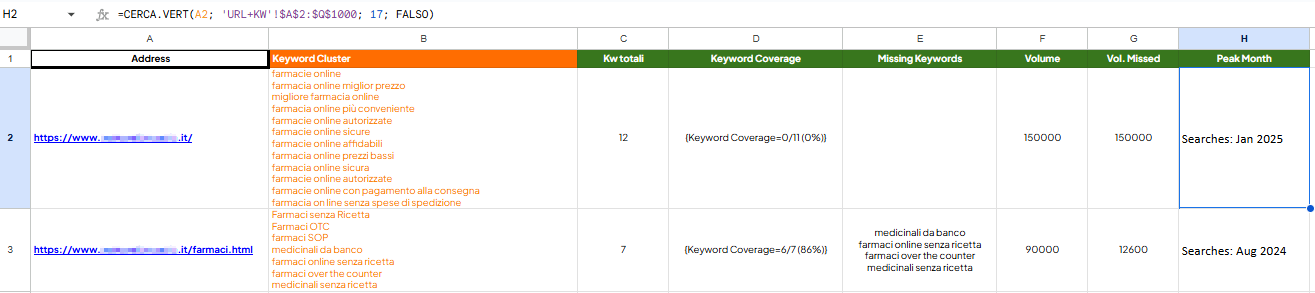
- Using VLOOKUP() or INDEX() + MATCH(), map each keyword (both found and missing) to its search volume.
Below is an example of the expected output.

What You Can Now Calculate
At this stage, you’ve combined an initial qualitative check (keyword presence on-page) with quantitative data (search volume). Even without access to Search Console or Analytics, this allows you to derive meaningful SEO KPIs that can guide prioritisation and strategic decisions.
Here’s what you can extract from your dataset:
- Total cluster search volume: The overall demand around the topic your page is meant to rank for. This becomes your addressable market from an SEO perspective.
- Volume covered vs. volume missed: How much of that demand you’re already addressing, and how much is being left untapped.
- % of missed opportunity: A simple yet powerful KPI to compare pages and identify which clusters suffer from the biggest content gaps.
- Optimisation priority score: By weighting opportunity against the strategic importance of each URL, you can build a data-informed optimisation roadmap, even in the absence of traffic metrics.
This stage turns a basic coverage audit into a business-relevant insight layer. It allows SEOs, strategists, or consultants to back up content decisions with clear, defensible data – especially useful during audits, pitches, or early-stage planning.
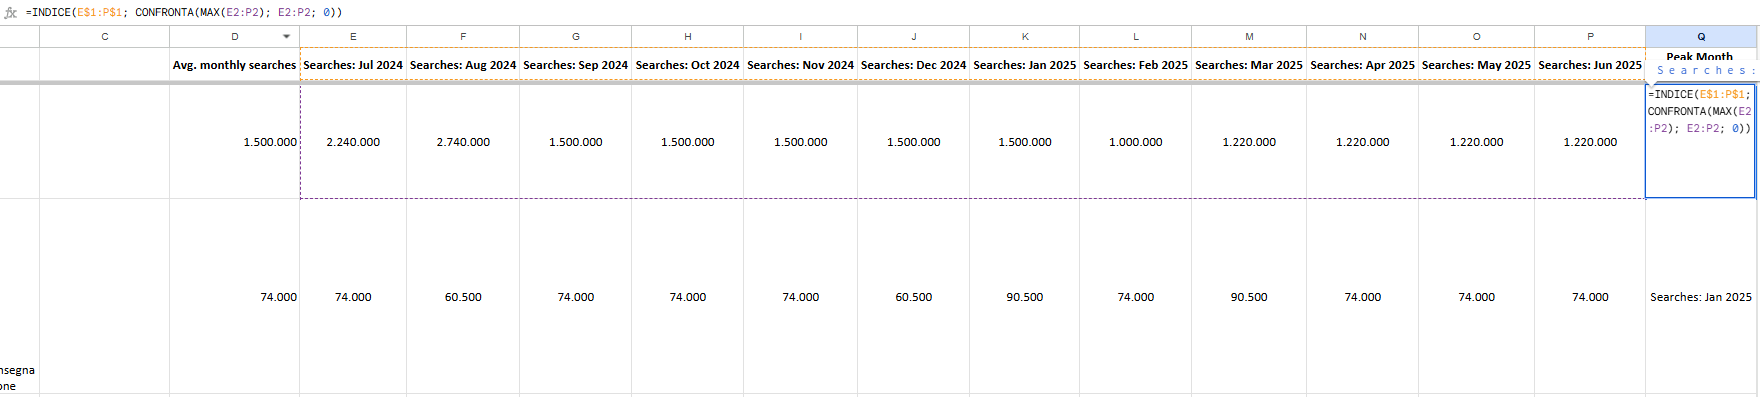
Evaluate Seasonality
Understanding when your audience is searching is just as important as what they’re searching for. While many SEO workflows stop at average monthly volume, Google Keyword Planner goes one step further, offering granular monthly trend data that reveals real-world seasonality across your keyword clusters.
This layer of insight is especially valuable when you’re planning content updates, launches, or campaigns without access to performance data. Seasonality helps you prioritise not just what to fix, but when to act.
How to Use Seasonality Data
Use the monthly search volume breakdowns to:
- Identify Peak Demand Months
- Break down the monthly search volume for each keyword in your cluster and sum it across the group. This allows you to visualise which months consistently generate the most search interest. Recognising the demand curve behind your topics gives you a deeper understanding of how the market or niche behaves over the year, and lets you prepare ahead of time.
- Plan Content Refreshes Strategically
- Once you’ve identified the peak months, map your optimisation and publishing calendar accordingly. For example, if your cluster’s missing keywords hit their highest search volumes in November and December, that tells you exactly when to prioritise content revisions to capture that wave. The same logic can apply to long-tail seasonal keywords, giving you a first-mover advantage without waiting on GSC trends.
Bonus tip: you can automate this part in Google Sheets by calculating the peak month per row and surfacing it as a label (e.g. “Peak: November”), giving a quick filtering option for prioritisation.
Practical Example
Let’s say you discover that many of the missing keywords for your /farmaci.html page, such as “over the counter cold medicine” or “flu remedies without prescription” experience a significant spike in December. This seasonal increase likely correlates with winter-related health issues like colds, flu, and respiratory infections, which drive a surge in demand for non-prescription medication.
That insight alone already changes how you prioritise your SEO roadmap. Instead of treating this cluster as evergreen content, you now know it has a critical seasonal window. Now imagine this method applied to a blog section. By identifying a particular month is the peak of search volume, you can reverse-engineer your timeline. For this page, the month could be December, so:
- Start refreshing and optimising the content in late Q3 (September), leaving enough lead time for indexing and SERP adjustments.
- Schedule any supporting link-building campaigns in early Q4, ensuring that authority signals are in place before traffic surges.
- If you’re running paid campaigns, align ADV budgets and messaging with this same timing for unified visibility.
This kind of data-driven seasonality insight moves you from reactive SEO to proactive planning. You’re not just fixing issues, you’re anticipating when the market is most ready to engage, and ensuring your pages are in peak condition right when it matters most.
Assess the Cost of Not Ranking
Once you’ve mapped out the keywords your pages are not targeting – and tied those gaps to concrete search volumes – you can start putting numbers to your missed opportunities.
It’s no longer just a question of “are we optimised?” but rather:
- What is the search demand we’re currently leaving on the table?
- What business value could we unlock by improving our coverage and alignment?
This kind of insight shifts the conversation.
It allows you to move away from vague SEO recommendations and toward quantified impact: ideal for stakeholder meetings, budgeting discussions, or consulting pitches.
In contexts where first-party data isn’t available (yet), it provides a compelling way to demonstrate early value and strategic direction, especially when trying to earn trust or unlock investment in SEO efforts.
Final Thoughts
This approach isn’t meant to replace the precision of Google Search Console, nor the depth of analytics tools and it doesn’t have to.
Instead, it fills a critical gap: for small websites, early-stage SEO projects, or audits where data access is limited, this method offers a practical, scalable way to evaluate keyword alignment at the page level.
It gives you:
- A quick framework to assess content-topic alignment
- Early visibility into optimisation gaps tied to search demand
- A data-backed roadmap to guide tactical SEO actions — even before performance data is available
By combining Screaming Frog’s Custom JS capabilities, Google Keyword Planner’s volume and trend data, and the flexibility of Google Sheets, you unlock a lean but powerful workflow.
It’s lightweight, modular, and scalable — perfect for quickly surfacing opportunities and building momentum in the early phases of an SEO engagement.
And hey, just imagine the value of this analysis once you’re able to merge your keyword cluster insights with real SEO performance data from Google Search Console, or even BI-level transactional data.
It opens the door to far more advanced use cases: predictive models, forecasting, and new ways to define SEO presence in this next era of search — one shaped by AI-powered results, AI Overviews, and soon, even AI Mode.
We’re only scratching the surface.


0 Comments