Bulk Testing PageSpeed Insights with the SEO Spider
Richard Lawther
Posted 6 August, 2018 by Richard Lawther in SEO
Bulk Testing PageSpeed Insights with the SEO Spider
Update: With the release of Spider version 12, you can now connect directly to the PageSpeed Insights API, letting you grab all your PageSpeed data automatically in the Spider — no XPath needed. Take a look here.
Google does a great job of providing a variety of tools for SEO’s and webmasters to use, and although they may not provide the most detailed analysis available, they’re about as close as we can get to see exactly how Google views our web pages.
The trouble with these tools is that they’re all based on a single URL at one time, and scaling them across an entire domain can be a time consuming and tedious task. However, with our very own Spider and its extraction capabilities here to lend a hand, you can easily automate most of the process.
For example, If we look at PageSpeed Insights (PSI) & Lighthouse, Google recently launched the speed update to their core algorithm so these scores (while fairly general) will become increasingly valuable metrics to measure page performance and recommend optimisations appropriately. So, in order to bulk test multiple URLs at once, just follow the steps below:
Get your URLs
To get started you’ll need to change all your existing domain URLs from this:
https://www.screamingfrog.co.uk/
into this
https://developers.google.com/speed/pagespeed/insights/?url=screamingfrog.co.uk/
So go ahead and grab an excel list of every single URL you’d like some page speed data on, if you don’t have a list already, just give your site a crawl and take it straight from the tool, or download via the sitemap.
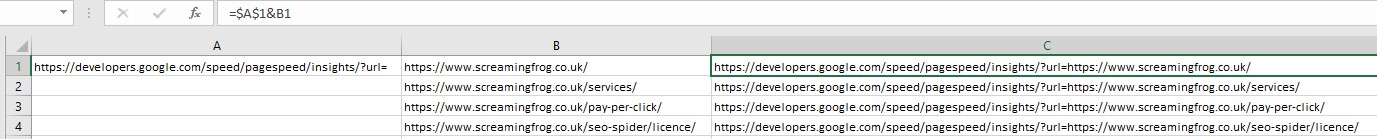
Next, you’ll need to add a cell containing the default Page Speed Insights URL:
https://developers.google.com/speed/pagespeed/insights/?url=
Once that’s in just use a quick formula in the adjacent cell to join them together into your nice PSI friendly URL.
=$A$1&B1
Once this is copied down it should look similar this:
Adjust your settings
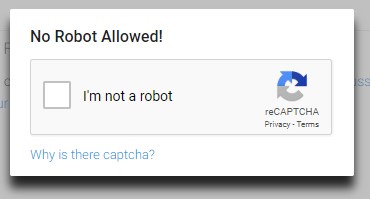
Now you’ve got the URLs sorted you’ll need to make sure Google doesn’t realise you’re using a bot and bring down the Captcha hammer on you straight away.
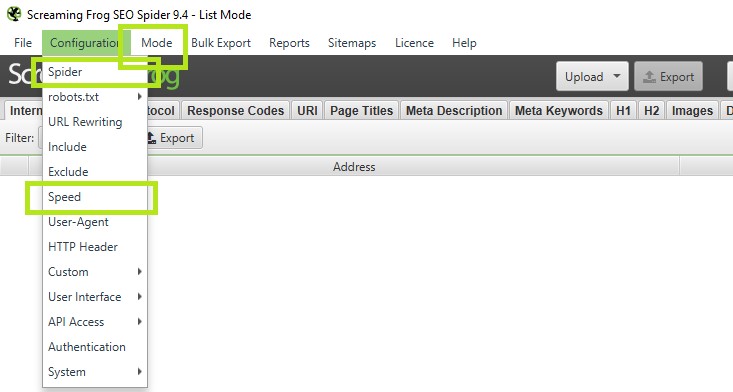
- Switch the tool over to list mode, (on the top menu > Mode > List).
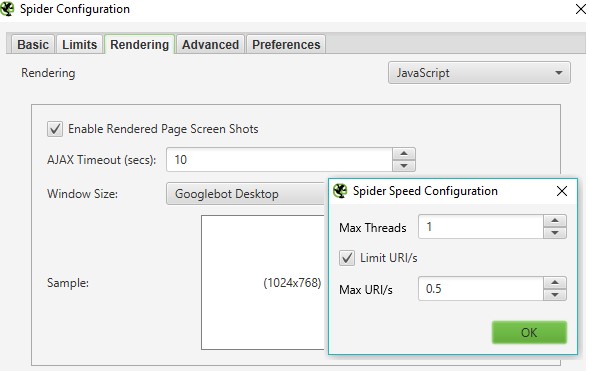
- Head over to the rendering panel sitting under Configuration > Spider > Rendering- turn on JavaScript rendering, we also want to increase the AJAX timeout from 5 seconds to 15-20 for safe measure.
- Go to the speed panel (Configuration > Speed) turn the max threads to 1 and the Max URL/s to somewhere between 0.1 & 0.5 a second. You might need to play around with this to find what works for you.
Extract
Now that the tool can crawl and render our chosen URLs, we need to tell it what data we actually want to pull out, (i.e: those glorious PageSpeed scores).
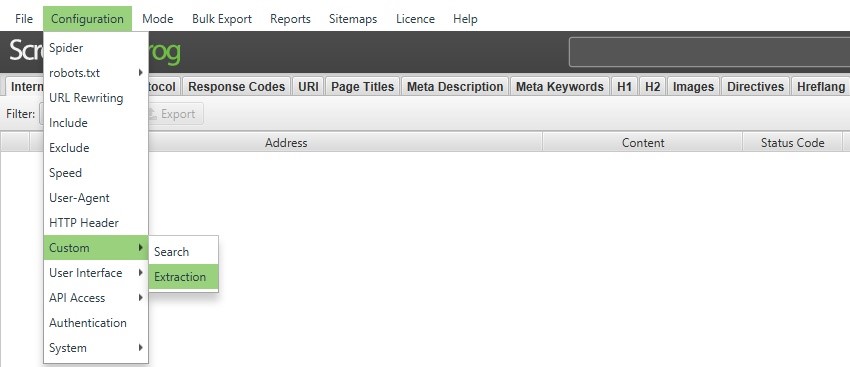
- Open up the custom extraction panel, (Configuration > Custom > Extraction) and enter in the following Xpath variables depending on which metrics you want to pull.
Mobile Score
(//div[@class="lh-gauge__percentage"])[2]
Desktop Score
(//div[@class="lh-gauge__percentage"])[3]
Field Data
Mobile First Contentful Paint (FCP)
(//div[@class="metric-value lh-metric__value"]//text())[1]
Desktop First Contentful Paint (FCP)
(//div[@class="metric-value lh-metric__value"]//text())[5]
Mobile First Input Delay (FID)
(//div[@class="metric-value lh-metric__value"]//text())[2]
Desktop First Input Delay (FID)
(//div[@class="metric-value lh-metric__value"]//text())[6]
Lab Data
Mobile First Contentful Paint
(//div[@class="lh-metric__value"]//text())[1]
Desktop First Contentful Paint
(//div[@class="lh-metric__value"]//text())[7]
Mobile First Meaningful Paint
(//div[@class="lh-metric__value"]//text())[4]
Desktop First Meaningful Paint
(//div[@class="lh-metric__value"]//text())[10]
Mobile Speed Index
(//div[@class="lh-metric__value"]//text())[2]
Desktop Speed Index
(//div[@class="lh-metric__value"]//text())[8]
Mobile First CPU Idle
(//div[@class="lh-metric__value"]//text())[5]
Desktop First CPU Idle
(//div[@class="lh-metric__value"]//text())[11]
Mobile Time to Interactive
(//div[@class="lh-metric__value"]//text())[3]
Desktop Time to Interactive
(//div[@class="lh-metric__value"]//text())[9]
Mobile Estimated Input Latency
(//div[@class="lh-metric__value"]//text())[6]
Desktop Estimated Input Latency
(//div[@class="lh-metric__value"]//text())[12]
If done correctly you should have a nice green tick next to each entry, a bit like this:
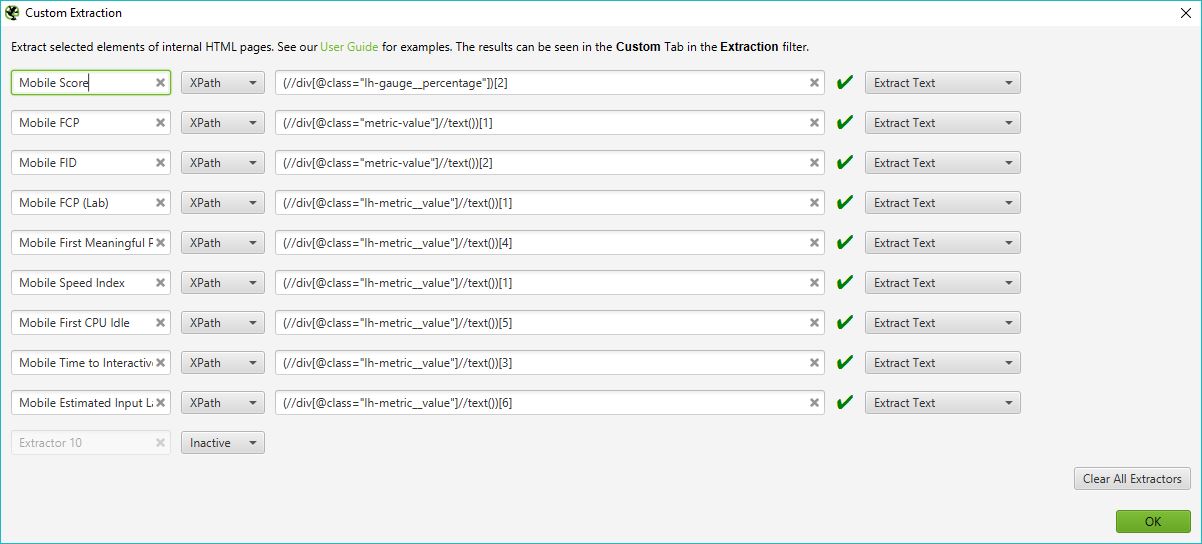
(Be sure to add custom labels to each one, set the type to Xpath and change the far right drop down from extract HTML to extract text.)
(There are also quite a lot of variables so you may want to split your crawl by mobile & desktop or take a selection of metrics you wish to report on.)
Hit OK.
Crawl
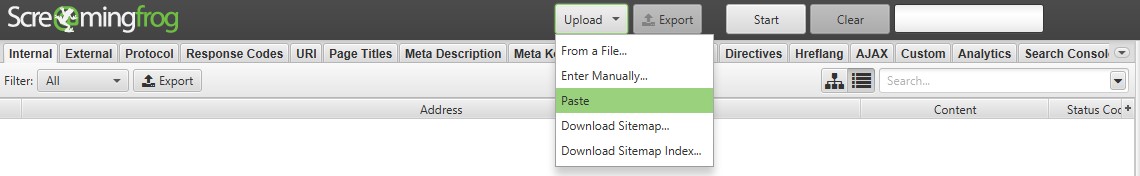
That’s it, you’re done! Once all the above has been sorted simply highlight and copy your list of URLs in excel, switch to the tool hit the upload > Paste, then sit back and relax as this will take a while. I’d recommend leaving it running in the background while you scroll through cat videos on YouTube or your preferred procrastination method of choice.
Export & Sort
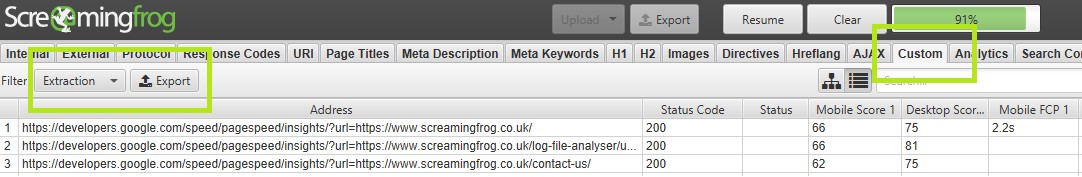
After a coffee/nap/cat-vid, you should hopefully come back to a 100% completed crawl with every page speed score you could hope for.
Navigate over to the custom extraction tab (Custom > Filter > Extraction) and hit export to download it all into a handy .xls spreadsheet.
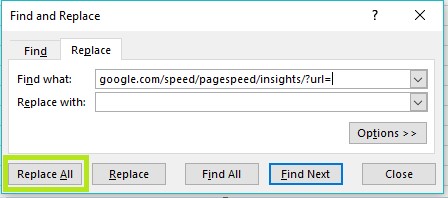
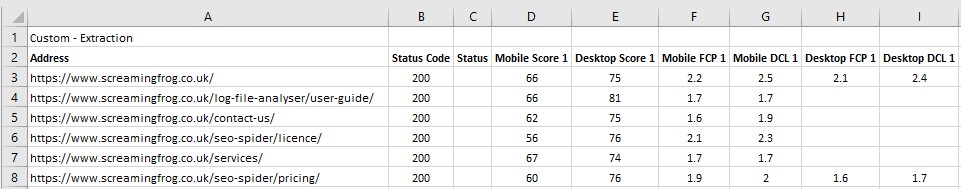
Once the export is open in Excel hit the find and replace option and replace https://developers.google.com/speed/pagespeed/insights/?url= with nothing. This will bring back all your URLs in the original order alongside all their shiny new speed scores for mobile and desktop.
After a tiny bit of formatting you should end up with a spreadsheet that looks something like this:
Bonus
What I find particularly powerful is the ability to combine this data with other metrics the spider can pull through in a separate crawl. As list mode exports in the same order its uploaded in, you can run a normal list mode crawl with your original selection of URLs connected to any API, export this and combine with your PSI scores.
Essentially allowing you to make an amalgamation of session data, PSI scores, response times, GA trigger times alongside any other metrics you want!
Troubleshooting
If set up correctly, this process should be seamless but occasionally Google might catch wind of what you’re up too and come down to stop your fun with an annoying anti-bot captcha test.
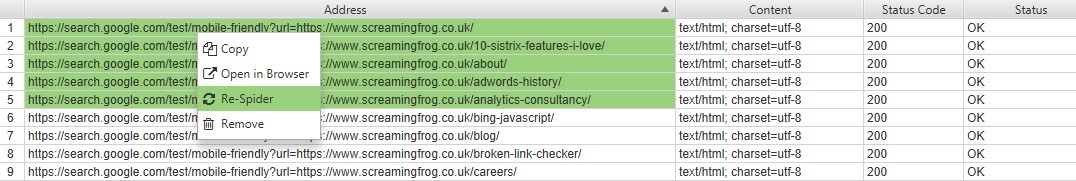
If this happens just pause your crawl, load up a PSI page in a browser to solve the captcha, then jump back in the tool highlight the URLs that did not extract any data right click > Re-Spider.
If this continues the likelihood is you have your crawl speed set too high, if you lower it down a bit in the options mentioned above it should put you back on track.
I’ve also noticed a number of comments reporting the PSI page not properly rendering and nothing being extracted. If this happens it might be worth a clear to the default config (File > Configuration > Clear to default). Next, make sure the user-agent is set to ScreamingFrog. Finally, ensure you have the following configuration options ticked (Configuration > Spider):
- Check Images
- Check CSS
- Check JavaScript
- Check SWF
- Check External Links
If for any reason, the page is rendering correctly but some scores weren’t extracted, double check the Xpaths have been entered correctly and the dropdown is changed to ‘Extract Text’. Secondly, it’s worth checking PSI actually has that data by loading it in a browser — much of the real-world data is only available on high-volume pages.
Final Thoughts
What’s great about this is if you have any other online tools similar to PSI, you can adapt the extraction feature to pull out any of your necessary data, (however, this won’t work for every tool and some of Googles others are a bit less lenient towards bots).
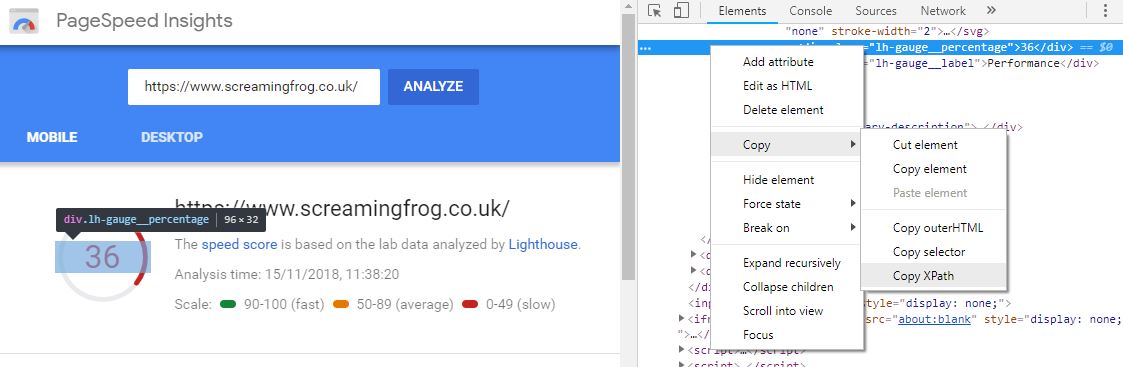
Simply find and right click on your chosen metric > Inspect to load up the rendered HTML. Within that panel again right click on the area with your metric > Copy > Copy Xpath and add it into the extraction setting within the Spider.
Et voilà, you now have access to your very own bulk testing tool, for more details on the scraping potential of the SEO Spider, it’s worth checking out our web scraping run through here.
I hope this quick guide was helpful and should you run into any problems, or have any other useful tricks with the extractor function then let us know in the comments below.


Nice Article
Very nice approach to measure page speed accurately. Totally agree with the common problem of people generalizing a website’s page speed based on a single URL.
Wow! This load of information helps me to figure out how to deal with my sites speed. Thank you, Richard, for the share, I will bookmark this to capture the process whenever I forget the gold steps you have highlighted. Thumbs up!
Such an Awesome Post !!
Love It !!
I did not get a result when I did this operation. A domain extension is a newly emerged domain extension .vin extension. I get a negative result I can not get results because my site address seo.vin is a new extension for you?
Hi Martina,
It looks as though PSI doesn’t have sufficient real-world speed data for the domain to display the FCP & DCL scores, You should still be able to extract the optimization scores though.
Best post in years! Keep up the good work.
Screaming frog is a great tool, i’m getting more and more in to it, and discover everyday news things which for i used to use an other tool. Seems like you guys are getting all tools into one. The “couteau suisse” of SEO. Thanks for that and freemium feature.
Hi Richard,
Thank you for this amazing post.
Would really be helpful to know the page speed of all the competitors
Screaming Frog is really getting good at scraping different parameters which helps SEO Enthusiasts
Will come for more such posts again
Thanks Richard!
Awesome Richard!! Mobile friendly and Page speed of your website has to be faster than 2.6sec to load especially on mobile devices in order to enter the ranking race for keywords nowadays. Keep screaming great post coming Mr frogs.
Epic! Thanks for that Richard – perfect addition to our tech SEO audit checklist.
Great article Richard. Thx a lot.
Richard, very well-done! Super helpful.
Would you consider creating a similar post for using the newer, much more accurate mobile speed test tool – https://www.thinkwithgoogle.com/feature/mobile/
Thanks.
good idea !
an atypical use of very useful Screaming Frog.
What a timely post! This answers exactly what I was looking for and works great :-)
That’s a smart way to use ScreamingFrog spider, the re-spider function is nice to fight back the anti bot captcha.
Hi,
This is a great article, and I see some responsed who get results.
But I don’t get any results. The status code of the URLs are 0, while when I copy and paste this into chrome they show the page.
You know what could be the problem? (Speed is low, I changed user-agent, no results)
Thanks
PageSpeed Insights got a redesign a few days ago, so to get mobile and desktop scores now, you’ll have to make these changes:
1. Go into Custom Extraction
2. Replace this text in the field for mobile score
(//div[@class=”speed-report-card”]//span[1])[1]
with
//*[@id=”page-speed-insights”]/div[2]/div[2]/div[2]/div[1]/div[1]/div[1]/div/a/div[1]
3. Still in Custom Extraction, replace this text in the field for desktop score
(//div[@class=”speed-report-card”]//span[1])[2]
with
//*[@id=”page-speed-insights”]/div[2]/div[2]/div[2]/div[2]/div[1]/div[1]/div/a/div[1]
Hi Tommy,
Thanks for sending this over, much appreciated!
I’ll be taking a look over the new PSI over the next few days and update the post with your info and any new metrics we can lift :)
Stay tuned.
Thanks,
Richard
Hi Tommy,
That was the exact updated Xpath. Thanks for sharing it.
But unfortunately it ain’t working for me. Especially the Mobile and desktop score.
Could you please advice me on this.
Thanks in advance.
Praveen
Hi Praveen,
I’ve just updated the post to reflect the new PSI metrics.
Have a go with them and let me know if you’re running into any trouble :)
Thanks,
Richard
Hi SF team! This is really nice article! It’s very helps me to optimize speed on my site.
Can this be taken a step further to extract the markup in the “Opportunities” area? Such as the opportunity description and savings numbers? I’m not too familiar with XPath at all so I am not sure where to start. Do you happen to have any resources for learning about XPath that you recommend?
Hi AJ,
These are a bit tricker as they change dynamically depending on what opps are listed.
But you should be able to use the following to get one detail at a time:
(//div[@class="lh-audit__title"][1])[2]You’ll need to change the last bracket [2] for each one (so a maximum of 10 at a time), and unfortunately, won’t include the potential savings.
In terms of Xpath resources, I’d recommend a chrome extension called ‘Xpath Helper’ mixed with a Xpath cheatsheet and alot of trial and error :)
Thanks,
Going off of this question – is it possible to extract the number of opportunities? I found that the following command returns the list of opportunities just in a bit of weird format but it does the job: //*[@id=”page-speed-insights”]/div[2]/div[2]/div[2]/div[2]/div[2]/div[1]/div[2]/div/div[3]/div[3]
In order to return the number of opportunities, I tried count(//*[@id=”page-speed-insights”]/div[2]/div[2]/div[2]/div[2]/div[2]/div[1]/div[2]/div/div[3]/div[3]) but it returns this: “Invalid Custom Extraction Configured”.
Any thoughts?
Hi Courtney,
Sorry for the delay, I was out of the office last week.
The closest I could get to counting the number of opportunities is using an XPath of: count(//div[@class=”lh-audit__title”])
Make sure to change the XPath dropdown from ‘Extract inner HTML’ to ‘Function Value’ in the Spider.
This will come back with the total number of opportunities for both mobile & desktop (I’m not sure if they can be separated).
Hope that helps :-)
Rich
This is a great guide Richard, will save me a lot of time! Keep up the good work :)
THIS is exactly what I was looking for; can’t wait to try this out on our client with 6,000+ pages who has suddenly decided to prioritize page speed despite a . Thanks for the comprehensive post!
Why all the configuration? Is there no way to save/load these configurations automatically? Kind of stupid that you have to manually set this up every time you want to do it… Not talking about the file you need as that I guess is pretty custom, but would be nice to be able to store and re-use all the configuration and mode.
Hi Dean,
‘File > Config > Save Config’, will store all this, it’s a one time set-up.
You can then choose the config file each time you want to use it.
Cheers.
Dan
Hey,
Looks like this is no longer working. I’ve set it all up as per the instructions above and I’m getting nothing back for any of my extractions.
The render screenshot is showing the main PSI screen with ‘There was a problem with the request. Please try again later.’
Is it likely that they’ve picked up on systems such as SF doing this? Changing the user agent didn’t seem to fix it :(
Sean
Hi Sean,
Couple bits worth checking:
Leave the user agent as SF.
Within Configuration > Spider make sure check images, check CSS, check Javascript and Check SWF are ticked.
If you’re still having trouble drop us an email and I can take a closer look.
Thanks,
Richard
Hi SF Team,
Thanks for this blog post, really useful, and I’ve saved the Custom Configuration for quick use in the future.
I think I discovered an error in your Custom Extraction codes above. I was having an issue with the Mobile Speed Index (Lab Data) not matching up (or coming anywhere close) to tests I ran on the Google PageSpeed Insights page. It looks like you have the wrong number at the end of the code. You show a “1” (which was just the same as the Mobile FCP (Lab)), but when I change it to “2” I get Mobile Speed Index results the same or almost the same from the PSI tests I’ve ran. If I’m correct, you’ll need to update the Custom Extraction code above and the screen capture as well. Thanks and keep up the good work and improvements to the Screaming Frog crawling software.
Hi Tony,
You’re right! I’ve updated the Xpath for the mobile speed index, so should be working again.
Thanks for bringing to our attention :)
Cheers,
Richard
A lot more reporting needs lately and this has given me so many ideas. Honestly, it’s been awhile since I got so excited reading a blog post, can’t wait to set this up. Thanks!
Hi Richard,
Thanks for the great tutorial. Unfortunately it doesn’t seem to work with the new PSI anymore.
The extraction doesn’t get any data and the “Rendered Page” screenshot is showing the PSI startpage.
Any workaround to get the PSI speed data for desktop and mobile with Screaming Frog?
Thanks a lot!
Christoph
Hi Christoph,
It’s still working on my end :-)
It might be worth double checking your user-agent is set to SF, and that you don’t have any rogue options set in the config (maybe worth a clear to default).
If you’re still having trouble drop me an email with a save of your crawl at [email protected] and I’ll have a closer look at what’s going on.
Cheers,
Richard
Thanks for your reply by mail Richard! It works like a charm now.
If anyone else is having my problem -> the ‘Check External Links’ option is essential.
Go to Configuration > Spider > tick the ‘Check External Links’ option
One of the best articles in pagespeed insights I have ever read!!! Great work!!
Keep returning “https://www.google.com/recaptcha/api.js?render=explicit” as the url being crawled. Seems to me recaptcha is getting in the way. Any thoughts on this? I have I’m not getting the usual captcha in browser, tried on my VPS as well. Getting the same “https://www.google.com/recaptcha/api.js?render=explicit”
All settings are as suggested. (Triple Checked)
Really just wont let me render.
This does not appear to be working. Value not returned – only trying to grab mobile page speed. Latest changes to PSI breaking this perhaps? Ideas?
Got it working! I had to set Rendering to Javascript :D
Another awesome use case for ScreamingFrog!
Will try it out!
This hasn’t been working for me. Tried all the troubleshooting people have mentioned in the comments and in the article above. Has anyone tried it recently?
Hi Max,
Yep, it still works — might be worth clearing your configuration to default (File > Configuration > Clear default Configuration) then re-enabling all the settings listed.
If that doesn’t work please drop me a save of your crawl (File > Save) to [email protected] and I’ll take a closer look.
Thanks,
Richard
You were right, Richard! Works perfectly. Appreciate your help. I tried resetting everything yesterday, but undoubtedly a mistake on my part led to it not working.
This works great!
Works. Thank you author! However, I am having problems with “Field Data”.
Desktop First Contentful Paint (FCP)
(//div[@class=”metric-value”]//text())[5]
Desktop First Input Delay (FID)
(//div[@class=”metric-value”]//text())[6]
They return empty cells.
Hi Petr. Are you certain the domain has field data within PSI?
Lots of sites don’t meet the threshold for CrUX data, so worth checking within the web-app first.
Cheers,
Richard
Hi Richard Lawther,
I checked, you’re right. No data for my pages. Thanks for help!
I noticed we weren’t getting any data for a couple of things (mainly FCP), and upon checking the XPATH of the div class in the insights tool, I noticed that it’s metric__value and not metric-value. So, instead of using the versions listed under Field Data (in the article) that look like this…
(//div[@class=”metric-value”]//text())[5]
…they should actually look like this…
(//div[@class=”metric__value”]//text())[5]
Hope this helps.
Hey Erik,
Yep you’re right, looks like they updated the tags again. I’ve updated the post so should all be working again :-)
Cheers for letting me know.
Thanks,
Richard
Awsome Richard. Thanks a lot for a great knowledge.
Thanks for the interesting article, really helpful.
Is it true that the pagespeeds also depends on which computer/tablet/smartphone you use?
Hi Richard, super post. Love screamingFrog. So far it works pretty fine. Did not hit the captcha up to know.
I think there are lots of nice adaption possible
Best Alexander
Very interesting this way of tracking the speed of your entire website.
Hi Richard, as of 24th Feb 2020, we’re not getting any data :( I tried to go PSI and update xpath tags but still no luck :(
Hey Gokhan,
It seems to be working on my end – might be worth clearing your config back to default and double-checking all the settings. If you’re still having trouble, drop me a line at [email protected] and can have a closer look :-).
cheers,
I will Richard, thank you :)
Hi Gokhan Tunc,
I have the same problem as Richard! It worked 3 weeks ago but not now with “12,6 version”.
Hey,
Drop me a line at [email protected] and we’ll get it going for you :-)
thanks,
Nice work! Thanks!
Best tutorial on page speed. Very comprehensive and detailed. Site speed is one the trickiest aspect of SEO. Many thanks
Looking a way to bulk test in PSI. Pretty cool approach. Google also offer free API key for testing speed. More info in their doc.
Hi Lukasz,
This post is quite old, you can do that now in the SEO Spider –
https://www.screamingfrog.co.uk/seo-spider/user-guide/configuration/#pagespeed-insights-integration
Cheers.
Dan
Does anyone have the Xpath for LCP?
I was wondering the same.
Feel free to delete previous comment. I’m a dork. :P
Hi Richard,
Long-time user, first-time commenter….
I was wondering if it’s possible (and whether it’s recommended) to create a template for SF crawls for PSI. I ran a quick search and also used the ‘Find’ function on this page to see if there was any mention of ‘template’. but couldn’t seem to find anything on this page. My apologies in advance if this information already exists, very much looking forward to your response.
Cheers,
J.P.
Hey J.P. You can now integrate PSI directly within the tool, so no need to save these Xpaths – there’s even a PageSpeed tab for all the results. You can see more here https://www.screamingfrog.co.uk/seo-spider/user-guide/configuration/#pagespeed-insights-integration.
If you’d still like to save a ‘template’ you can save the current configuration under File > Configuration > Save As. to quickly use for other crawls.
Thanks,
Richard
The connection with the API helped me with a lot with work more efficient. Thanks!
I always find it really hard to make my website go faster. Thanks for sharing this article.