PageSpeed Insights integration
Dan Sharp
Posted 22 October, 2019 by Dan Sharp in
PageSpeed Insights integration
Configuration > API Access > PageSpeed Insights
You can connect to the Google PageSpeed Insights API and pull in page speed and mobile usability data directly during a crawl.
PageSpeed Insights uses Lighthouse, so the SEO Spider is able to display Lighthouse speed metrics, analyse speed insights and diagnostics at scale and gather real-world data from the Chrome User Experience Report (CrUX) which contains Core Web Vitals from real-user monitoring (RUM). Lighthouse is also able to report on mobile usability issues.
There are two options to run PageSpeed Insights, ‘remote’ and ‘local’.

- Remote means Lighthouse is run on URLs on a remote server, and data is returned to the SEO Spider via the API. The benefits are it won’t consume your machines resource to run Lighthouse. It can also fetch CrUX page speed data.
- Local means Lighthouse runs directly on the users machine. The benefits are that this can be used for sites that require authentication to access them, and it’s not limited to 25k queries a day like the API. CrUX data is not available by running Lighthouse locally however.
Start the SEO Spider and go to ‘Configuration > API Access > PageSpeed Insights’, choose the ‘source, enter a free PageSpeed Insights API key if necessary, choose your metrics, connect and crawl.
Setting Up A PageSpeed Insights API Key
To set-up a free PageSpeed Insights API key, login to your Google account and then visit the PageSpeed Insights getting started page.
Once you’re on the page, scroll down a paragraph and click on the ‘Get a Key’ button.

Then follow the process of creating a key – by submitting a project name, agreeing to the terms and conditions and clicking ‘next’.

It will then enable the key for PSI and provide an API key which can be copied.
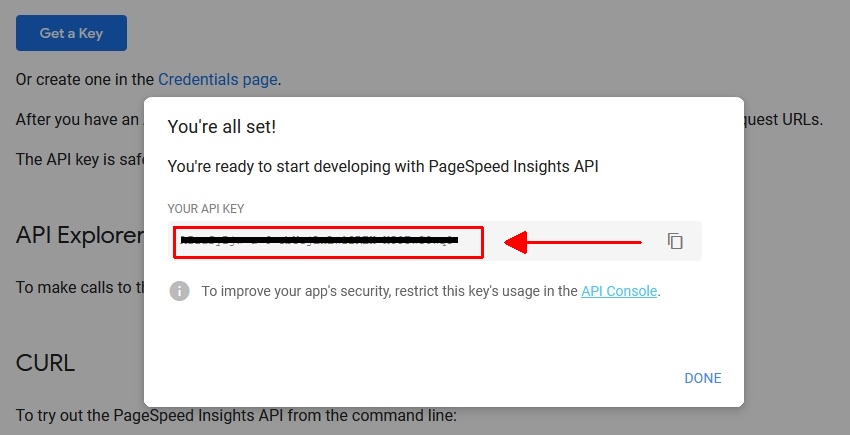
Copy the key, and click ‘Done’.
Then simply paste this in the SEO Spider ‘Secret Key:’ field under ‘Configuration > API Access > PageSpeed Insights’ and press ‘connect’. This key is used when making calls to the API at https://www.googleapis.com/pagespeedonline/v5/runPagespeed.
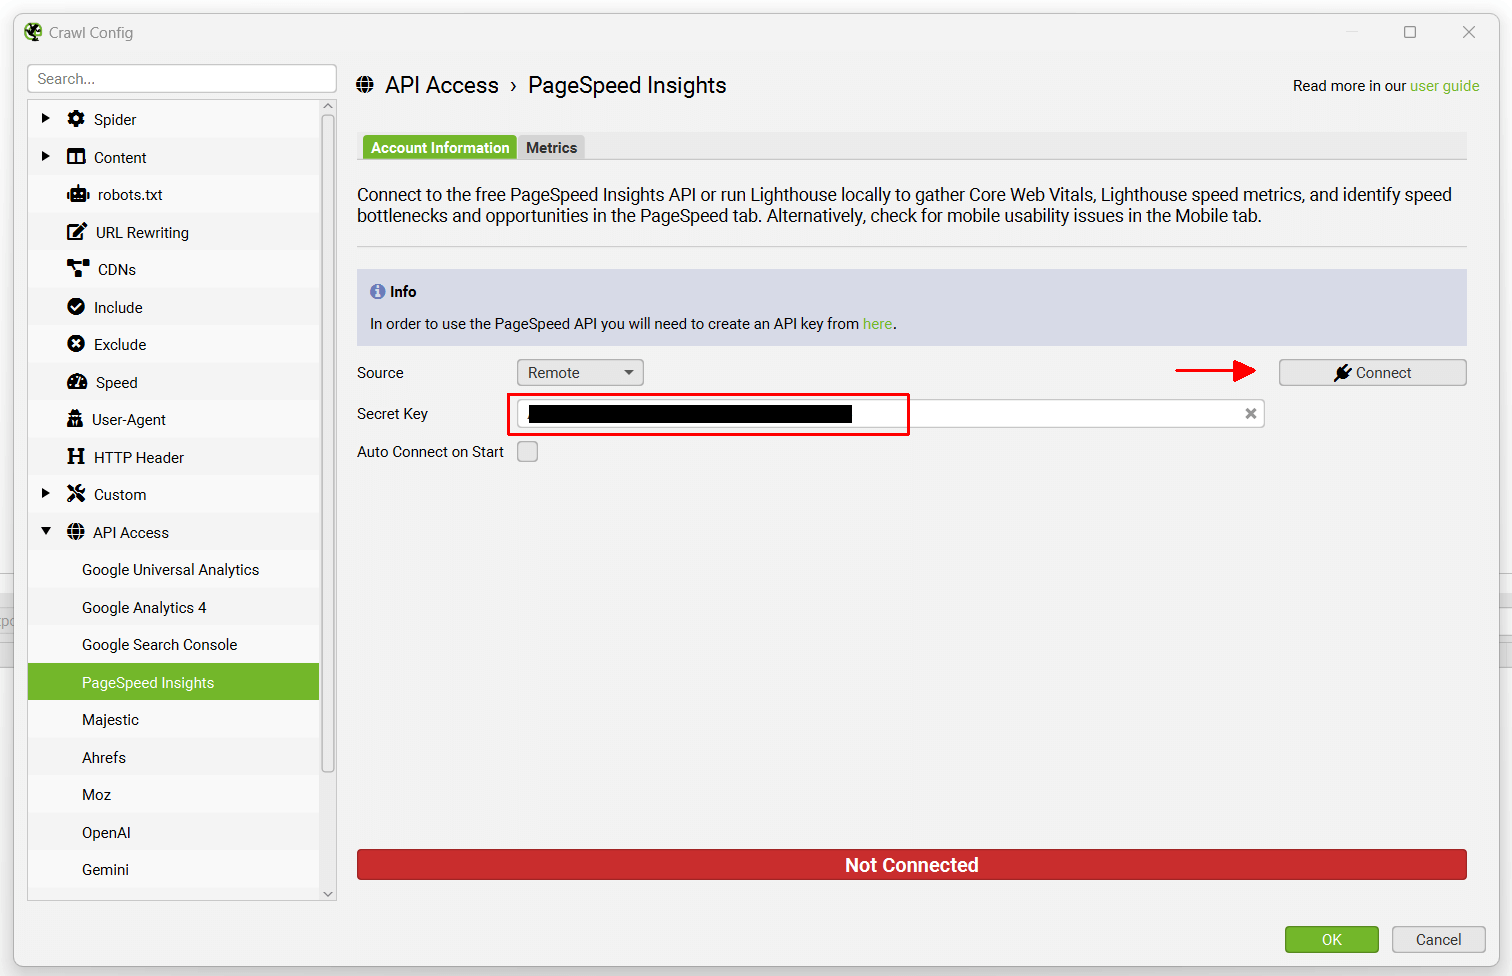
That’s it, you’re now connected! The SEO Spider will remember your secret key, so you can ‘connect’ quickly upon starting the application each time.
If you find that your API key is saying it’s ‘failed to connect’, it can take a couple of minutes to activate. You can also check that the PSI API has been enabled in the API library as per our FAQ. If it isn’t enabled, enable it – and it should then allow you to connect.
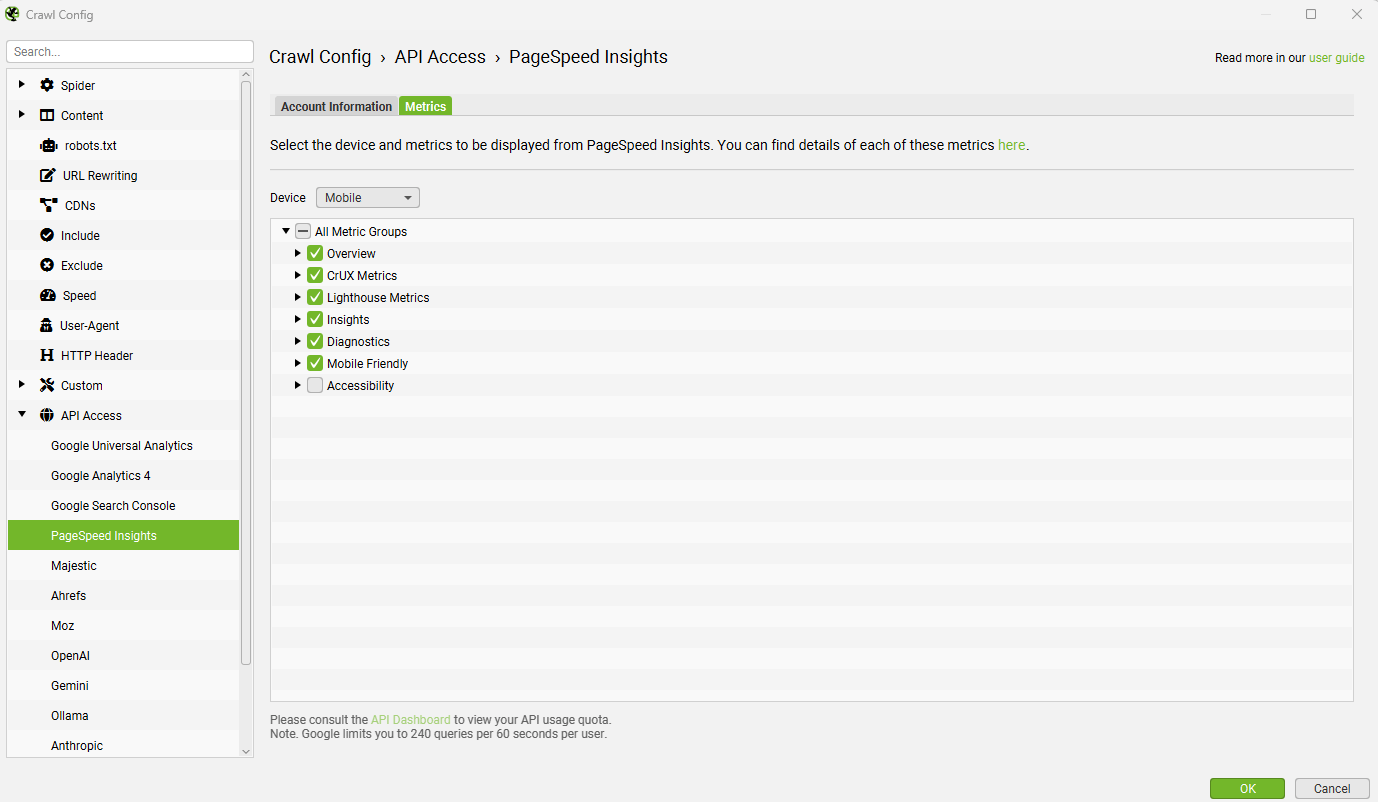
Once you have connected, you can choose metrics and device to query under the ‘metrics’ tab.
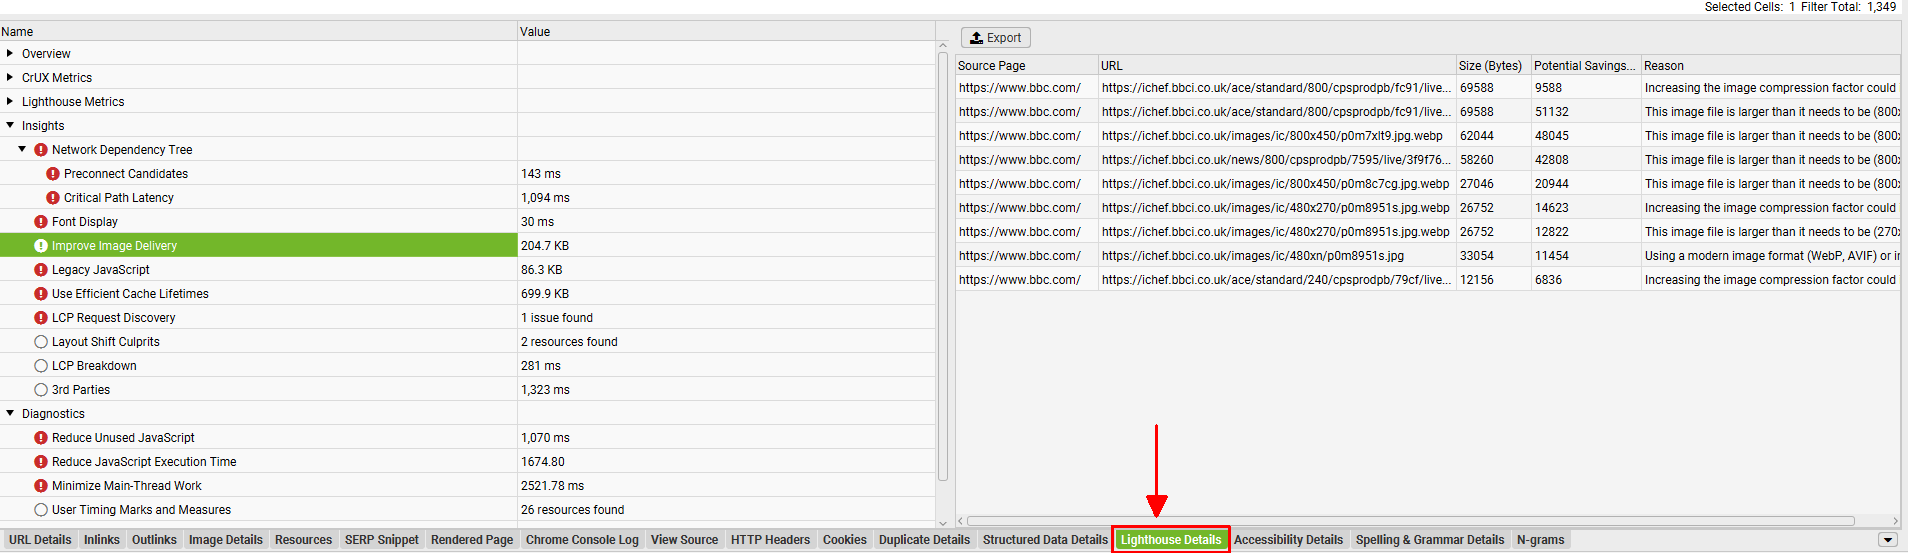
To view data and issues discovered, view the PageSpeed tab and Mobile tab in the SEO Spider.
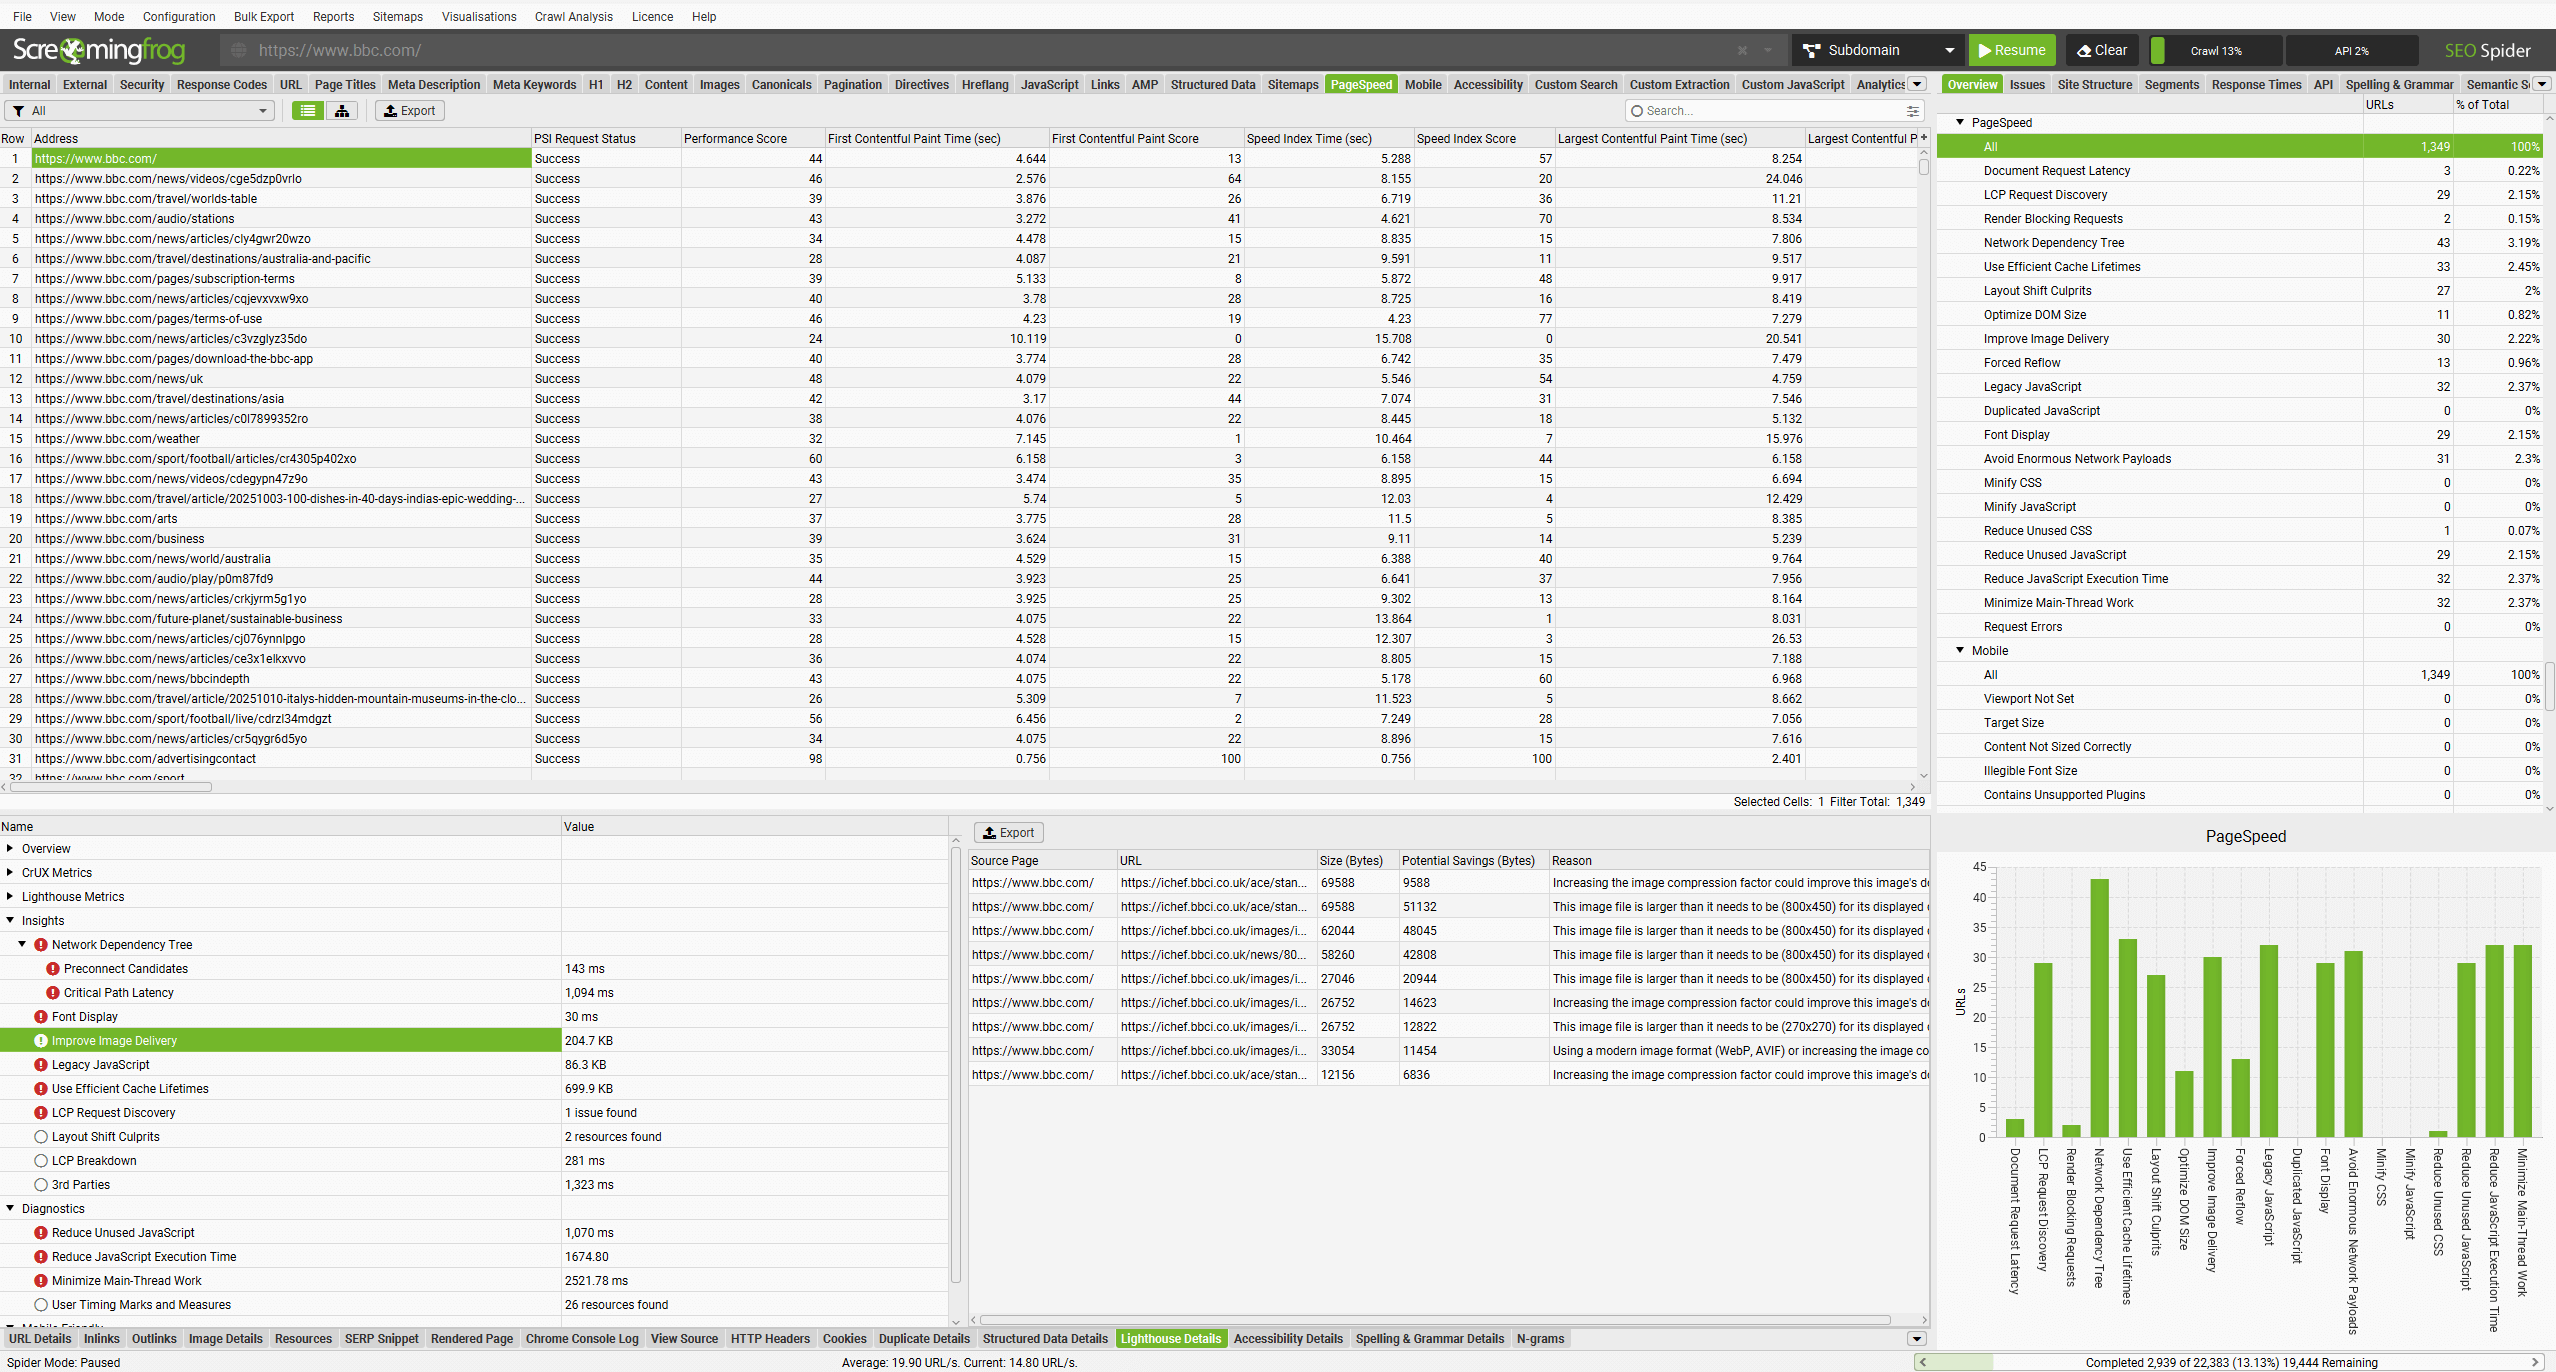
The lower ‘Lighthouse Details’ tab provides more granular detail about PageSpeed insights and mobile issues for each URL.
Check out our tutorials on How To Audit Core Web Vitals and How To Audit Mobile Usability.
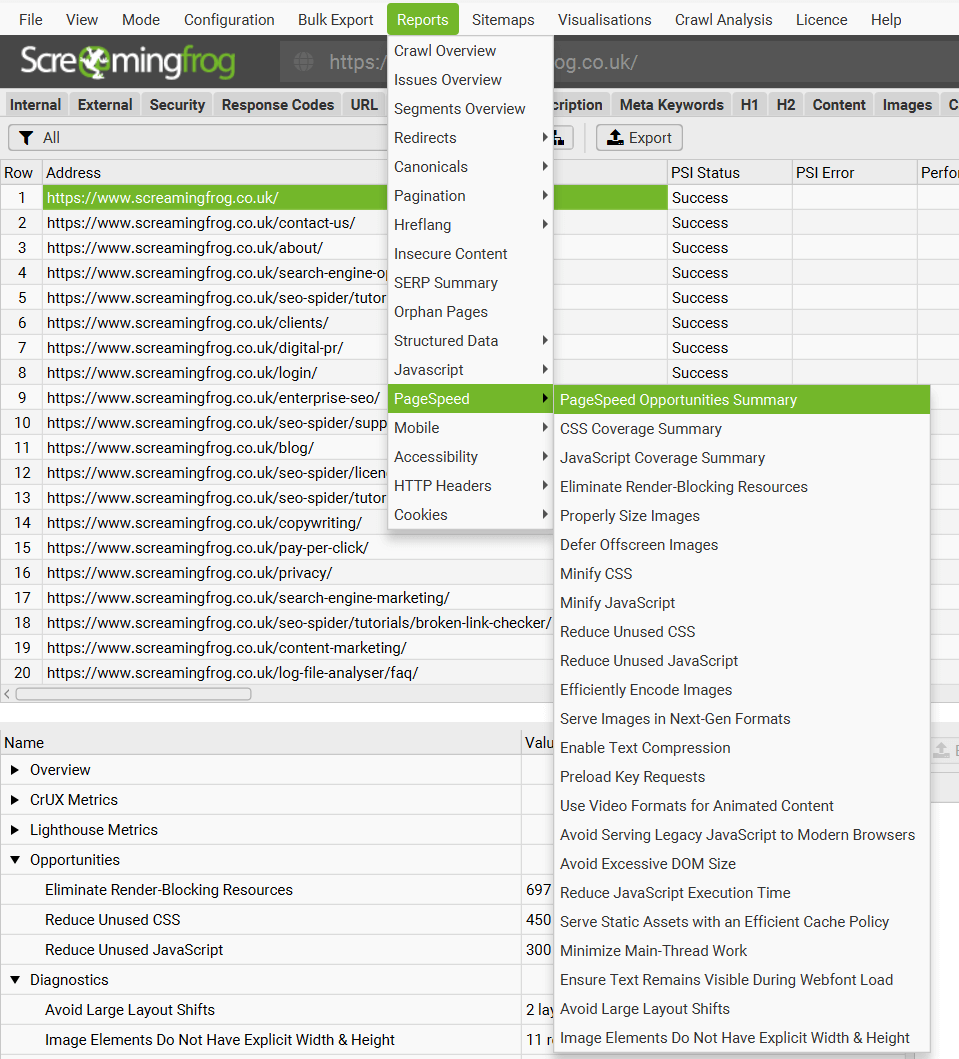
The following speed metrics, insights and diagnostics, and mobile issues, can be configured to be collected via the PageSpeed Insights API integration.
Overview Metrics
- Total Size Savings
- Total Time Savings
- Total Requests
- Total Page Size
- HTML Size
- HTML Count
- Image Size
- Image Count
- CSS Size
- CSS Count
- JavaScript Size
- JavaScript Count
- Font Size
- Font Count
- Media Size
- Media Count
- Other Size
- Other Count
- Third Party Size
- Third Party Count
CrUX Metrics (‘Field Data’ in PageSpeed Insights)
- Core Web Vitals Assessment
- CrUX First Contentful Paint Time (sec)
- CrUX First Contentful Paint Category
- CrUX Largest Contentful Paint Time (sec)
- CrUX Largest Contentful Paint Category
- CrUX Cumulative Layout Shift
- CrUX Cumulative Layout Shift Category
- CrUX Interaction to Next Paint (ms)
- CrUX Interaction to Next Paint Category
- CrUX Time to First Byte (ms)
- CrUX Time to First Byte Category
- CrUX Origin Core Web Vitals Assessment
- CrUX Origin First Contentful Paint Time (sec)
- CrUX Origin First Contentful Paint Category
- CrUX Origin Largest Contentful Paint Time (sec)
- CrUX Origin Largest Contentful Paint Category
- CrUX Origin Cumulative Layout Shift
- CrUX Origin Cumulative Layout Shift Category
- CrUX Origin Interaction to Next Paint (ms)
- CrUX Origin Interaction to Next Paint Category
- CrUX Origin Time to First Byte (ms)
- CrUX Origin Time to First Byte Category
Lighthouse Metrics (‘Lab Data’ in PageSpeed Insights)
- Performance Score
- First Contentful Paint Time (sec)
- First Contentful Paint Score
- Speed Index Time (sec)
- Speed Index Score
- Largest Contentful Paint Time (sec)
- Largest Contentful Paint Score
- Time to Interactive (sec)
- Time to Interactive Score
- Max Potential First Input Delay (ms)
- Max Potential First Input Delay Score
- Total Blocking Time (ms)
- Total Blocking Time Score
- Cumulative Layout Shift
- Cumulative Layout Shift Score
Insights
- Document Request Latency – Pages with resources that redirect, have a slow server response, or do not apply text compression. These can all contribute to latency and reducing page speed.
- LCP Request Discovery – Pages with a Largest Contentful Paint (LCP) request discovery that can be optimised.
- Render Blocking Requests – Pages with resources that are blocking the first paint of the page, along with the potential savings.
- Network Dependency Tree – Pages with a lot of latency on the critical path, caused by long chains and large resource download sizes.
- Use Efficient Cache Lifetimes – Pages with resources that are not cached, along with the potential savings.
- Layout Shift Culprits – Pages that have layout shifts on DOM elements without any user interaction such as elements being added, removed, or their fonts changing as the page loads.
- Improve Image Delivery – Pages where the download time of images can be reduced, improving the perceived load time of the page and Largest Contentful Paint (LCP).
- Forced Reflow – Pages with a forced reflow which can result in slowing down rendering and user interactions.
- Legacy JavaScript – Pages with legacy JavaScript. Polyfills and transforms enable legacy browsers to use new JavaScript features. However, many aren’t necessary for modern browsers.
- Duplicated JavaScript – Pages with duplicate JavaScript libraries across different code bundles. Lighthouse detects duplicated code that would be quicker to load once.
- Avoid Enormous Network Payloads – Pages with large network payloads that can reduce page speed. Large network payloads cost users real money and are highly correlated with long load times.
Diagnostics
- Minify CSS – Pages with unminified CSS files, along with the potential savings when they are correctly minified.
- Minify JavaScript – Pages with unminified JavaScript files, along with the potential savings when they are correctly minified.
- Reduce Unused CSS – Pages with unused CSS, along with the potential savings when they are removed of unnecessary bytes.
- Reduce Unused JavaScript – Pages with unused JavaScript, along with the potential savings when they are removed of unnecessary bytes.
- Reduce JavaScript Execution Time – Pages with average or slow JavaScript execution time.
- Minimize Main-Thread Work – Pages with average or slow execution timing on the main thread.
- Optimize DOM Size – Pages with a large DOM size with a large layout or style recalculation exceeding a duration of 40ms.
- Font Display – Pages with fonts that may flash or become invisible during page load.
Mobile Friendly
- Viewport Not Set – Pages without a viewport meta tag, or a viewport meta tag without a content attribute that includes the text width=.
- Target Size – Pages with tap targets that are too small or there is not enough space around them, which means they are difficult to interact with on mobile devices.
- Content Width – Pages with content that is smaller or larger than the viewport width, which means it may not render correctly on mobile devices.
- Font Display Size – Pages with small font sizes that can make it difficult to read for users on mobile devices.
For more details on each issue, warning or opportunity discovered, refer to our SEO Issues library.
The speed opportunities, source pages and resource URLs that have potential savings can be exported in bulk via the ‘Reports > PageSpeed’ menu.
PageSpeed Insights API Limits
The API is limited to 25,000 queries a day at 60 queries per 100 seconds per user. The SEO Spider automatically controls the rate of requests to remain within these limits. With these limits in places the best case is the SEO Spider can request 36 URLs a minute. So for a crawl of 10,000 URLs this would take just over 4.5 hours.
Please consult the ‘quotas’ section of the API dashboard to view your API usage quota.
PageSpeed Insights API Errors
The PSI Status column shows whether an API request for a URL has been a success, or there has been an error. An ‘error’ usually reflects the web interface, where you would see the same error and message.
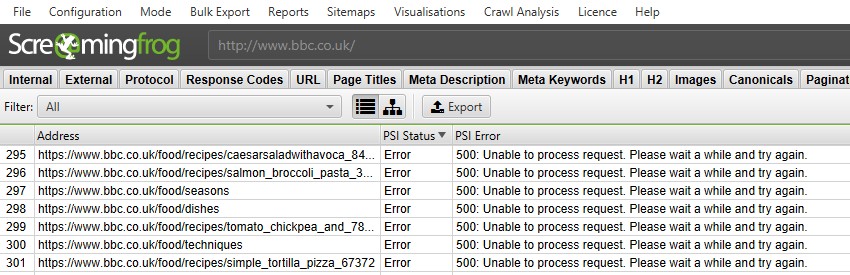
There two most common error messages are –
- “500: Unable to process request. Please wait a while and try again” – This error is generally replicable in the web interface and our testing suggests that from time to time the PSI API is unable to process requests, possibly due to overall load capacity. If this occurs, we recommend pausing the crawl for 10mins until it’s available again and working in the web interface, and then right click and ‘re-spider’ URLs. This will re-request the PSI data for those URLs selected and continue crawling and requesting API data for other URLs.
- “500: Lighthouse returned error: ERRORED_DOCUMENT_REQUEST. Lighthouse was unable to reliably load the page you requested.” – This error is again typically replicable in the web interface and is not an issue with the SEO Spider, or the API, it is directly related to the Lighthouse audit conducted by PSI. Unfortunately ‘re-spidering’ these URLs to re-request API data generally does not help. You can provide Google with feedback about any errors you experience directly on their mailing list or ask questions via Stack Overflow.
Please read our FAQ on PageSpeed Insights API Errors for more information.