Not Just a Pretty Graph – How to Use Screaming Frog Visualisation Tools
Emina Demiri-Watson
Posted 20 February, 2024 by Emina Demiri-Watson in Screaming Frog SEO Spider, SEO
Not Just a Pretty Graph – How to Use Screaming Frog Visualisation Tools
In SEO and digital marketing, seeing a pretty diagram or graph is very seductive. It’s the nerdy nature of the beast. We love data visualisation. But, showing a visualisation should never be just about making your PowerPoint presentation pretty. Luckily, Screaming Frog visualisation tools are pretty AND useful.
Here are just a few ways SEOs can use them in their everyday work.

This article is a guest contribution from Emina Demiri, Head of Digital Marketing at Vixen Digital.
Screaming Frog Visualisation Tools – A Quick Intro
If you’ve been working with Screaming Frog for a while, you likely already know a bit about the visualisation tools and where to find them. For those new-ish to it, you can find the Screaming Frog visualisation Tools tucked away within the visualisation drop-down when you open your spider.

You will see there are two ways to explore your website visually:
- Crawl visualisations – these visualisations will show you your website by the shortest path to a page from the start URL. So for example, if you are crawling your entire site your homepage will be the epicentre of the crawl and the other pages will be shown based on proximity (the link depth) to the home page.
- Directory visualisation – as the name itself suggests, directory visualisations let you explore your website on a directory level. The visualisation is hierarchical by URL component and path. The URLs represented are connected via a directory path and not links as is the case with crawl visualisations.
You will also notice that each type of representation has its own format. There are three formats in total:
- Force-Directed Diagrams
- These visualisations will show you the connections between objects – called “nodes”. The type of node connection will depend on whether you are using a Crawl visualisation (Force-Directed Crawl Diagram) or a Directory visualisation (Force-Directed Directory Diagrams – a bit of a mouthful right!). Another element to mention here are edges of a graph. You will want to keep those in mind as we go into the application.
- You’ll love them because they are pretty to look at (very symmetrical and nicely clustered) but their actual power will be explored later on!
- 3D Force-Directed Diagrams
- As the name hints, 3D Force-Directed Diagrams are basically Force-Directed Diagrams but in 3D. They are even more visually appealing, but again, where they really shine is in the application. Let’s face it, not everything needs to be in 3D but some analysis does benefit from the extra visual boost.
- Tree Graphs
- The somewhat less visually appealing sibling of the diagrams are the Tree Graphs. They display your website as a hierarchical structure – as a tree rather than a collection of circles. Unlike diagrams, Tree Graphs can look rather messy, particularly on larger sites. They are still incredibly useful for visualising and understanding your website.

For an in-depth look into the tools check out the Site Architecture & Crawl Visualisations Guide.
Which visualisation type and format you choose will depend on many things.
For one, the size of your website will play a big role. Very large websites might struggle with both Force-Directed Diagrams and Tree Graphs. A large number of nodes can make the visual cluttered and congested and hence not very usable.
Another consideration is what the end goal is. For example, let’s say you want to improve your sitemap and you want to explore your information architecture (IA) on your website to do this. To show the information architecture of your website it might be better to use the Force-Directed Crawl Diagram than the Force-Directed Directory Diagram. The former will show you the snapshot of how crawlers crawl your website which is a better proxy for a user. It will help you get ideas about how to create your new and improved sitemap. On the other hand, the Force-Directed Directory Diagram will show you how things are at the moment in terms of your website taxonomy.
Practical Applications for the Screaming Frog Visualisation Tools
While visualisation tools are a great resource, it’s important to first note that they should never be used as a replacement for a full website audit. For example, full IA audits should also include other analyses such as HotJar recordings and heatmaps, GA4 user flow analysis, real user research and journey mapping and much more.
They are, however, useful as snapshots: tools to quickly troubleshoot possible issues and supporting analysis in bigger pieces of research. So let’s dive into some interesting applications. Specifically, we’ll discuss how you can use the tools to help you:
- 1. Align topics/keywords and development content calendars
- 2. Quickly audit your information architecture and sitemap
- 3. Audit website URL patterns
- 4. Optimise crawling
- 5. Spot-check your internal links distribution
- 6. Check page speed at a glance
Alignment of Topics/Keywords and Development of Content Calendars
Understanding why topic and keyword research is important for SEO, your users and your business is considered to be one of the SEO fundamentals. From a very basic reductive understanding, it’s obvious why: if you own a website that sells elearning software and you want your potential customers to find you on search, you need to understand what people interested in elearning software are searching for and what their intent is behind those searches.
We won’t go deep into the more nuanced discussions here such as entity or programmatic SEO. Yes keyword research alone just doesn’t cut it these days. We are no longer talking about creating content based on keywords alone. But keywords remain in the mix and as SEOs, we all need to continuously work on our topic and keyword research.
Where Screaming Frog visualisation tools come into play is after you have done your topic and keyword research. They can be a great way to help you see how your website performs against it at the moment and where the gaps are. At least if your website is small or medium. Otherwise, as we said you might struggle with clutter!
Here are just two use cases where they can be useful.
Use a Directory Tree Graph for Smaller Blogs to Show How Your Content Aligns With Your Research and Where to Expand Your Content Calendar
Let’s say you’ve come up with an initial list of topics, assigned the keywords with the correct intent and evaluated the market opportunity based on estimated keyword volume. The next step might be to see how your current website – your blog in particular – compares to the research you have done.
This is where a Directory Tree Graph comes in handy. As mentioned, it will show you a tree graph of your blog hierarchy. And, unless your URLs are not optimised at all (more on that later on!), it will show you a bird’s eye view of your content. Even better if you have your website organised with categories and tags as then you’ll be able to see on a topic level what you have been writing about and if it aligns with the market opportunity. It will also help you spot any opportunities at a glance for planning your content calendars.
Here’s an example of how this might work with our SEO category blog.
Scaling Force-Directed Crawl Diagrams With Gsc, Easily Spot Which Pages Are Getting the Most Clicks and Find Further Opportunities
Force-Directed Crawl Diagrams are particularly useful when scaled properly and integrated with other tools. One must-have is the Google Search Console integration.
Using this integration allows you to easily spot pages that are getting a lot of clicks and as a result dig in deeper. For a visual learner, this can be much stronger than the Search Console interface. It allows you to have a bird’s eye view of your whole website in terms of one of the most important KPIs for traffic – your clicks.
Once you have hooked up your Console to Screaming Frog, scaling the data is easy. All you need to do is run the Force-Directed Crawl Diagram, click on Settings and choose GSC clicks.
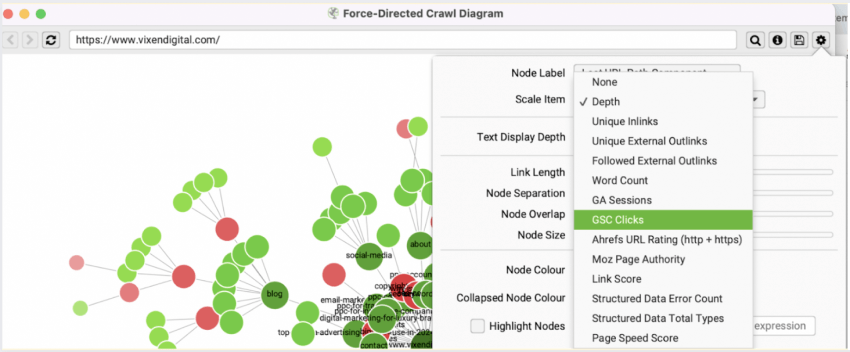
Once results are generated your pages with the most clicks will be coloured darker green, and the lower the clicks the lighter the colour.
The next step is to critically examine the darker green circles and to use other tools to help you deepen the analysis.
Note: ignore the homepage which will usually be the darkest depending on where you started the crawl. Or you can start the crawl from your blog if you just want to see clicks for that area of your website.
There are a few questions to consider here:
- Why are these pages getting the most clicks?
- What keywords are they ranking for?
- Are they the right keywords – do they target the right intent and the right audience?
- Are people converting from this page? – check GA4
Depending on the answers, you could look at the following:
- What is the value of this page?
- Can we add a signup form on this page?
- Do we want to expand our content calendar and write more about this topic?
- What do we need to do to improve the rankings of this page?
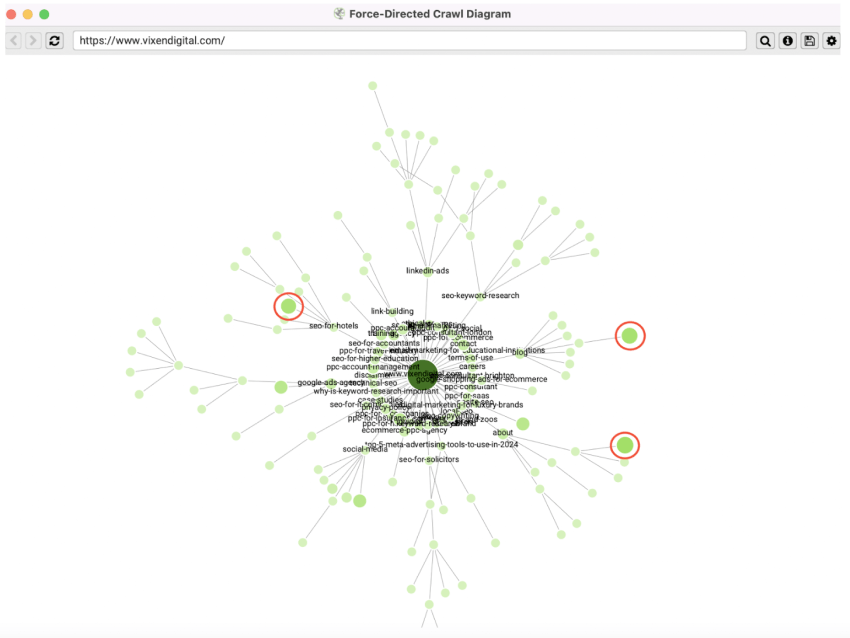
A great example of this process is our own Vixen Digital Instagram post below.
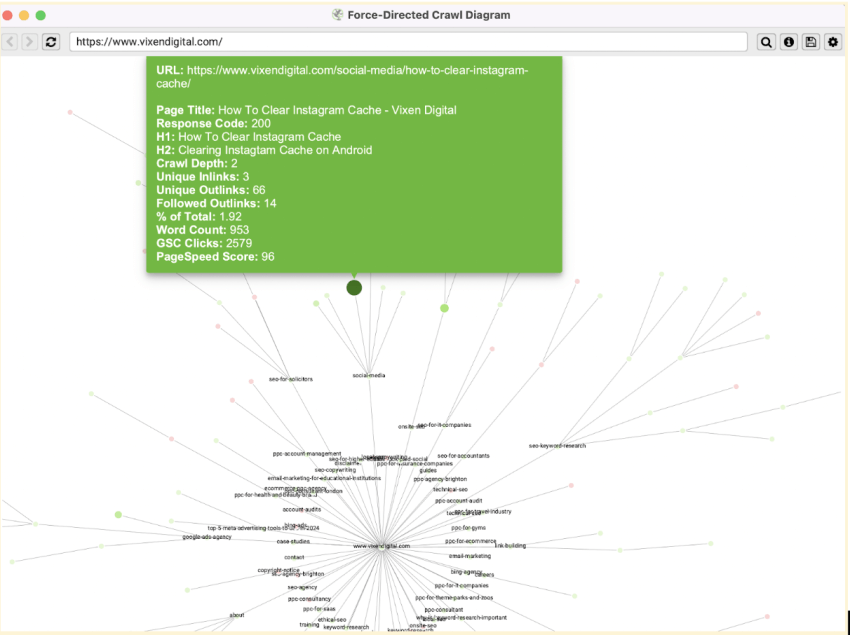
The green node represents an Instagram-related post that has been getting a lot of clicks. It ranks for a number of Instagram-related keywords:
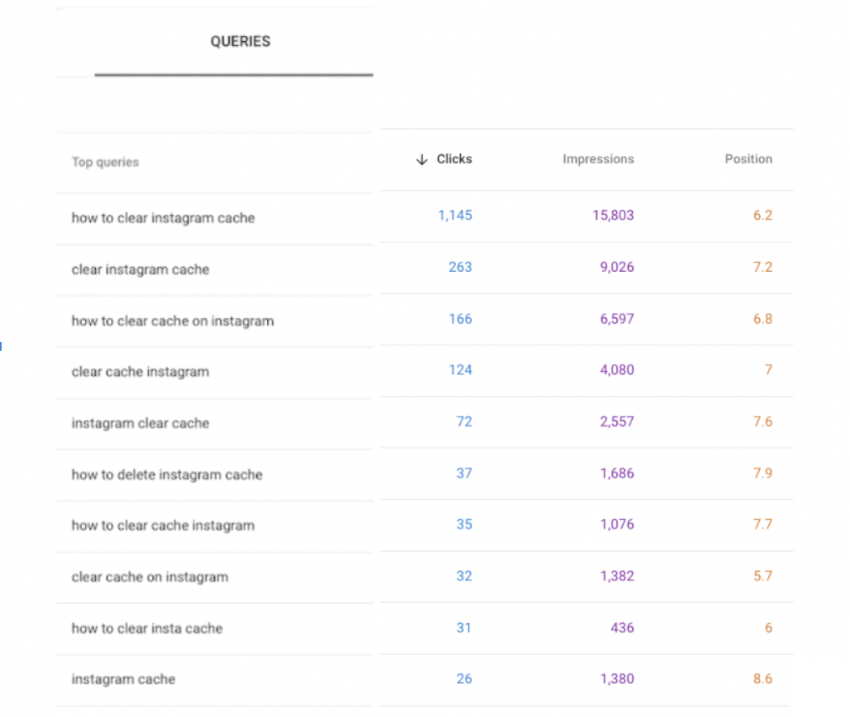
It is getting us traffic, however, looking at the keywords we can see the intent here is informational and most likely not aligned with our audience. The users looking for these terms are likely to be the general public, as opposed to our target audience which of Marketing Managers. The GA4 conversion data supports this with no conversions in the last 6 months.
However, this page was not created simply to rank for the keywords in question, it is part of our efforts to increase the visibility of the agency in the space of Instagram advertising.
A quick look at the Force-Directed Crawl Diagram has given us a potential action we could take to capitalise on the popularity of this page. For example, we could test adding a Newsletter sign-up on the page to capture the small percentage of the audience that are Marketing Managers. Or we could ensure we expand on the topic and improve the internal linking, giving us a greater chance to establish ourselves in the Instagram advertising space.
The whole analysis took 20 minutes to complete and was solely driven by running the Force-Directed Crawl Diagram. And, yet we already have several ideas on how we can further improve results for this particular page.
Website Information Architecture and Sitemap Audit and Development
One of my favourite uses for visualisation tools are in the realm of website IA and sitemaps. As mentioned previously, which tool you use can make a difference here.
For IA I prefer to use the Force-Directed Crawl Diagram as it shows me how crawlers see my website. On the other hand, for sitemap, my preference is the Force-directed Directory Diagram which shows me how my website is structured on a Directory level.
Of course, IA and sitemaps are connected. You should always base your sitemaps on understanding your IA. Great IA analysis is followed by an effective sitemap.
This is particularly useful for auditing websites for migration, where there is an opportunity to improve both the IA and, subsequently, the sitemap. The last thing you want to miss is the opportunity during the migration to improve your website. A lift-and-shift approach is never recommended! Ideally, you want to do your research and perform all the necessary tasks such as full IA audits and user journeys. To ensure your new website serves users and search engines better than the old one!
The analysis of the two Force -Directed Tree Diagrams can be a decent basis for starting to look at optimising IA for our website as well as using this for the development of a new sitemap.
Here’s how it could work.
Organising Your Blog Categories Based on Topics and Bringing Them Into the Sitemap
Again we are assuming here you’ve done the hard work to prepare for this. You are migrating your website and you want to ensure that your topic and keyword research are also informing your new website architecture.
Let’s use the example of our website and the SEO category folder for our blog and how this might help kick-start conversations within our company about optimising during a migration.
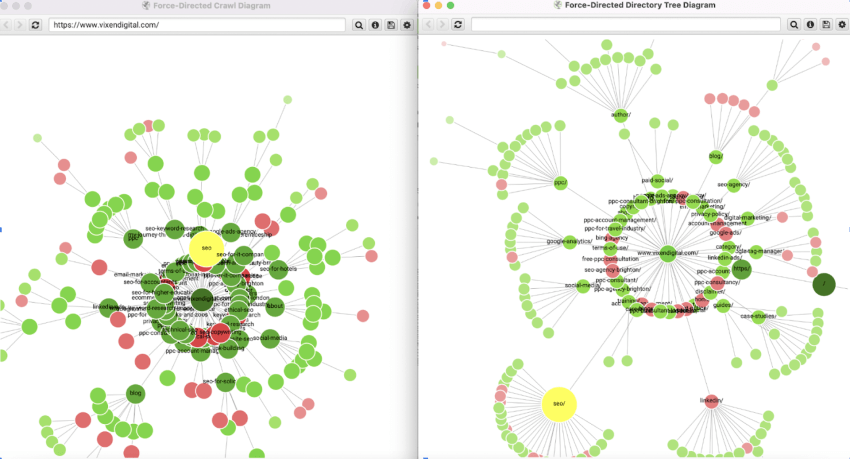
From the snapshots, I can see that one of our categories, SEO, has a very short path (only one click deep) on the Forced-Directory Crawl Diagram. Unsurprisingly it sits in the /SEO directory and I can see we already have quite a few blogs on the subject.
As this is one of our main agency services. The category is important for our business and our ideal customer. We want to make sure that our thought leadership is seen and part of the journey for our SEO persona. At the moment, this important category has:
- Low depth which is great
- Is in the right folder – again great
But what are the other opportunities here? For example, users cannot easily find this category on the website. They need to click on a blog and then click on a category tag and only then do they see our SEO thought leadership.
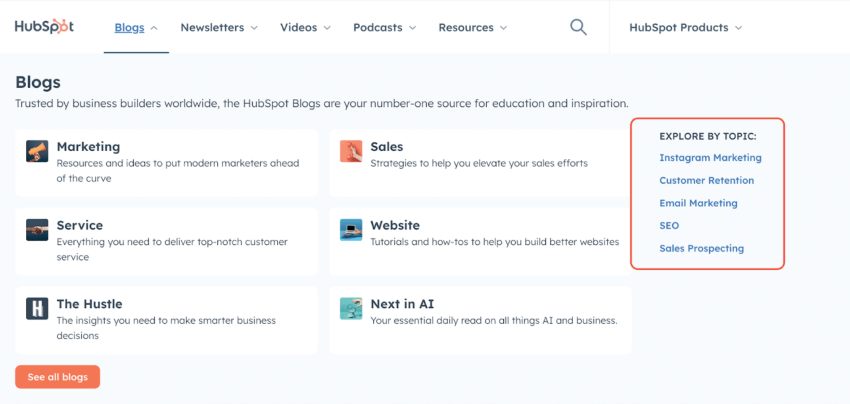
This analysis then leads to further discussion of possibly tweaking the sitemap where the most important categories are brought into areas such as the top nav. See below an example of Hubspot:
Easily Spot Issues or Further Opportunities in Categorisation
Categorising your content on the website is useful for both search engines and users. But more often than not, we see clients who are just not doing it or are doing it but not strategically. If you have done your topic and keyword research correctly, your categories should follow this analysis. After all, those are the topics and keywords that your users are searching for and if you’ve estimated the market opportunity you already have a great way to prioritise your categories and your future content.
Directory Tree Graph is a great tool to get a quick understanding of this. On smaller and medium sites that don’t have a ton of categories, the tree graph will show you a bird’s eye view of your category names. This is a great starting point for discussions around topics and keyword alignment (or the lack of!).
Here is an example of one of our clients:
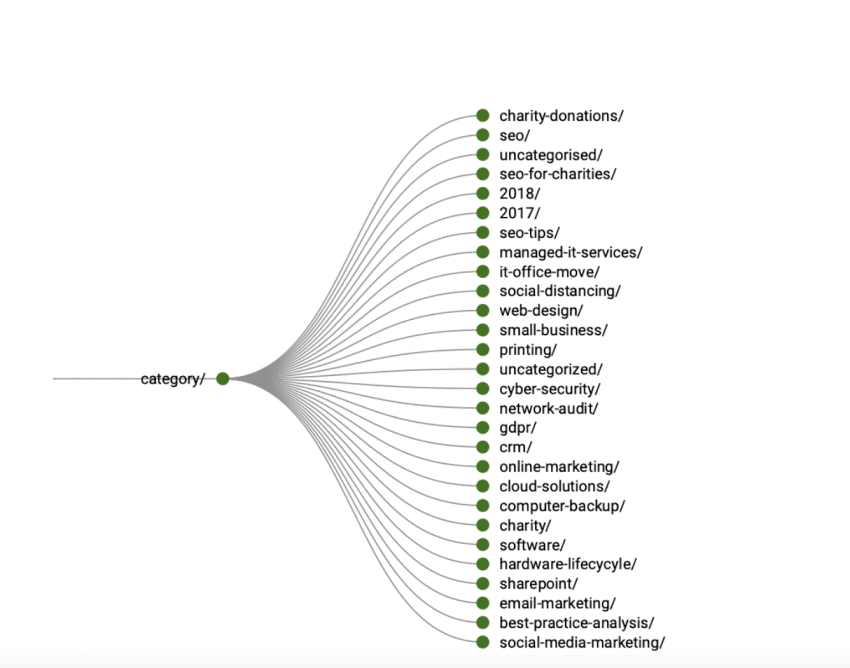
Following the tree graph we can see right away that some of these categories do not follow the topic and keyword research. For example, it-office-move, printing, seo (and seo-tips) and the numbered categories.
There are also missed opportunities we can easily spot. For example, the category software is an opportunity to expand into specific software topics to improve UX.
This client has Microsoft Office 365 support as a primary service and did not have it as a blog category. Further analysis also showed that some categories had only one blog in them.
This simple Tree Graph was the first conversation opener with the client. Subsequently, we developed a new categorisation using user journey analysis, topic opportunity analysis and a workshop with the team.
Checking URL Patterns
Closely connected to topic and keyword research and using Visualisation tools to figure out what content is being written and why, is the question of URLs. We know in SEO that optimising your URLs based on keyword research is still relevant for ranking.
And, Directory Tree Graphs are perfect for this! You can very easily and visually see how optimised or not-optimised your URLs are. I like to use it again on a category level since it allows me to segment my focus based on topics with the best market opportunities. You first explore those categories that have the best opportunity in terms of intent and estimated volume.
Exploring URL Optimisation Using Directory Tree Graph on a Category Level
Let’s use our Vixen Digital SEO category, again very important for our business as we sell those services.
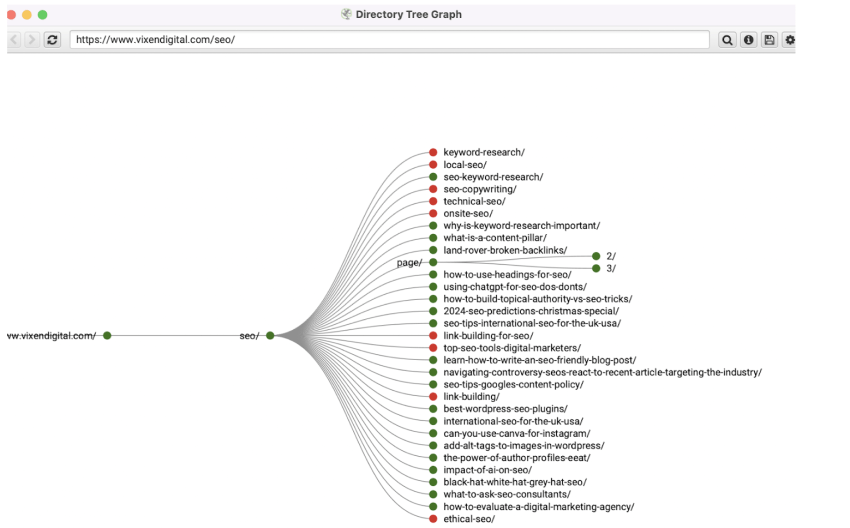
Let’s ignore for now that some of them are red nodes, we’ll cover that later on. Plus, the pagination here is something we should look at but we cover that later as well. For now, what I am interested in is the URL structure and how this reflects our topic and keyword research. I can already see that the URLs are optimised. They are descriptive and mostly include relevant keywords, they are unique, the URLs are mostly below 50 characters (Google will typically only show the first 50 characters) and in cases where there are more than 50 characters the keywords are at the start of the URL. From a technical standpoint, the structure also looks good with best practices such as the absence of numerical IDs and underscores, using upper case characters and avoiding non-ASCII characters.
While this will certainly not make or break your rankings (Google’s algorithm has over 200 signals!) it is part of the URL structure best practices and can have an impact.
Optimising Crawling
Another SEO fundamental is ensuring your website is optimised for crawling. A lot of the examples already mentioned will help search engines better crawl your website. Things like IA, categories, and optimised URLs all have an impact on crawling.
The importance of crawling for SEO cannot be underestimated. It’s the first step in how search engines discover a webpage and part of the holy trinity of search: crawling, indexing and ranking!
In a very reductive way, the logic is clear, if your website has crawling issues then how can you expect it to be indexed or ranked. From simple crawling issues such as an accidental no-index tag to more complex crawl budget challenges that arise with extra large sites or medium sites with rapidly changing content – we’ve seen it all!
Force-Directed Crawl Diagram, is super useful for troubleshooting crawling issues, particularly the simple ones!
Spotting Non-indexed Business-Critical Pages
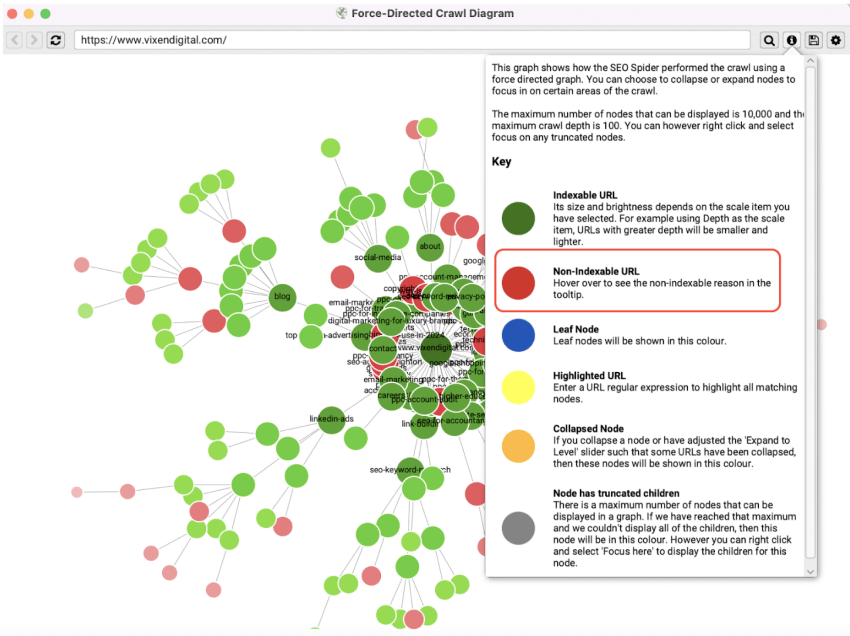
We are finally at the mystery of the red node. You might have noticed some red nodes in the previous analysis in this blog. These are the pages you should pay attention to when it comes to crawling.
Your indexable pages are marked as green, while the pastel red are non-indexable URLs. By using the Force-Directed Crawl Diagram you can easily spot problematic sections or pages of a website.
You should also dig deeper into the reason why these pages are not indexed. Sometimes there are valid reasons for this (eg. the page has been canonicalised to the correct version). Other times the reason is a 404 or a redirect, in which case deciding if that’s the behaviour you would want is a bit more complex.
Using this tool we have managed to spot all kinds of actual crawling issues with our clients! Two examples include a non-indexed Home page (more common than you would think in migrations!) and an old Contact Us page that was a 404 and linked to several other prime traffic pages.
Spotting Business-Critical Pages That Are Hidden Deep Into the Site Architecture
Another element to explore in the Force-Directed Crawl Diagram are the light green on the outskirts of the diagram. These pages are this colour and at the edges because they are far away from the initial starting point of the crawl (usually your Home page). In other words, they are buried deep. The question is should they be? And, The Force-Directed Crawl Diagram is the first step in answering this question. It will give you a view of any business-critical pages you might want to look deeper into by using Directory Tree Graph which will show you the actual depth of those pages in a Tree Graph form.
We did this a few times with our clients.
For example, this client’s website had critical service pages 4 levels deep. Plus this analysis also allowed us to spot several service location pages. Which should only be used if there is a legitimate reason and differences in services per location!
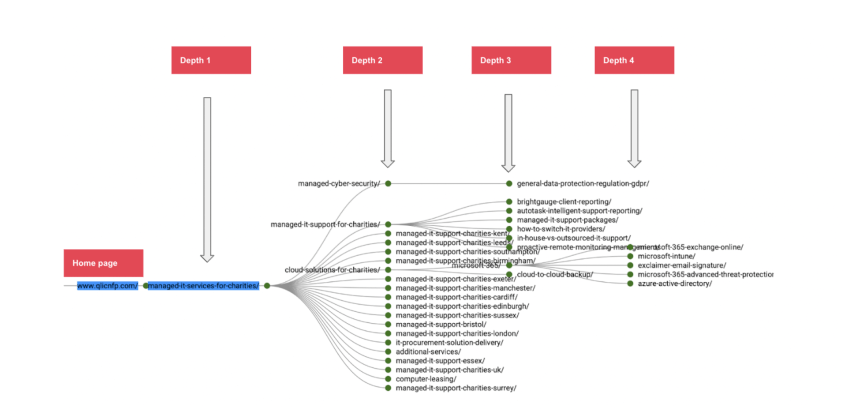
Both findings were a basis to go back to the client and start conversations around their website IA and optimising the site for crawling.
Spot-Checking Your Internal Links Distribution
Internal links are one of the most undervalued strategies in the SEO toolkit. Links are important for both users and search engines in many ways. They allow users to navigate a website and help search engines to understand a website’s architecture. And, while PageRank is not as relevant today as it was for Google ranking, it remains embedded in search engine systems in some form or another. And, internal links are still a ranking factor!
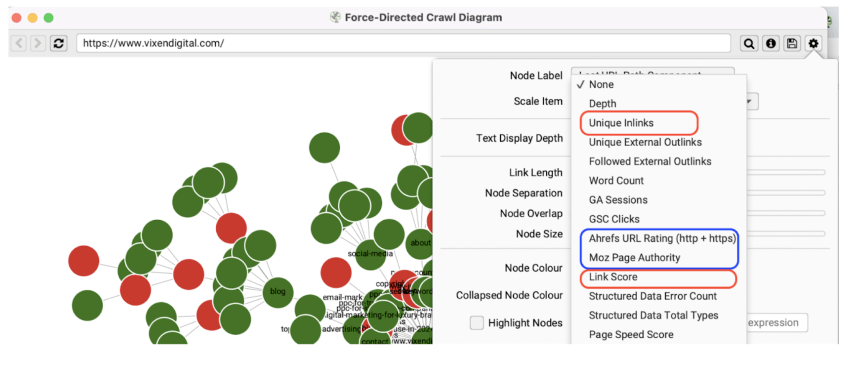
One great application for Force-Directed Crawl Diagrams is in the realm of links. Both Force-Directed Crawl Diagrams and Force-Directed Directory Diagrams allow you to scale the data based on several relevant factors. For link analysis, you will want to use the Force-Directed Crawl Diagram. How you scale will depend on what types of links you are interested in. For internal links, particularly useful are Unique Inlinks (number of internal links pointing to pages) and LinkScore (internal PageRank throughout the site). For external links, proprietary metrics such as the Ahrefs URL ranking and Moz Page Authority might give you a very broad idea of backlink power.
Here are a couple of ideas for link-related applications.
Exploring Pages With Force-Directed Crawl Diagram Scaled With Inlinks to Check on Your Internal Linking
Let’s use our agency website as an example. You can see below that there are already a few light green circles that might need checking. A quick run though has already pointed out a possible opportunity. One of our commercially relevant blogs on the topic of how much PPC agencies charge has only 3 Inlinks.
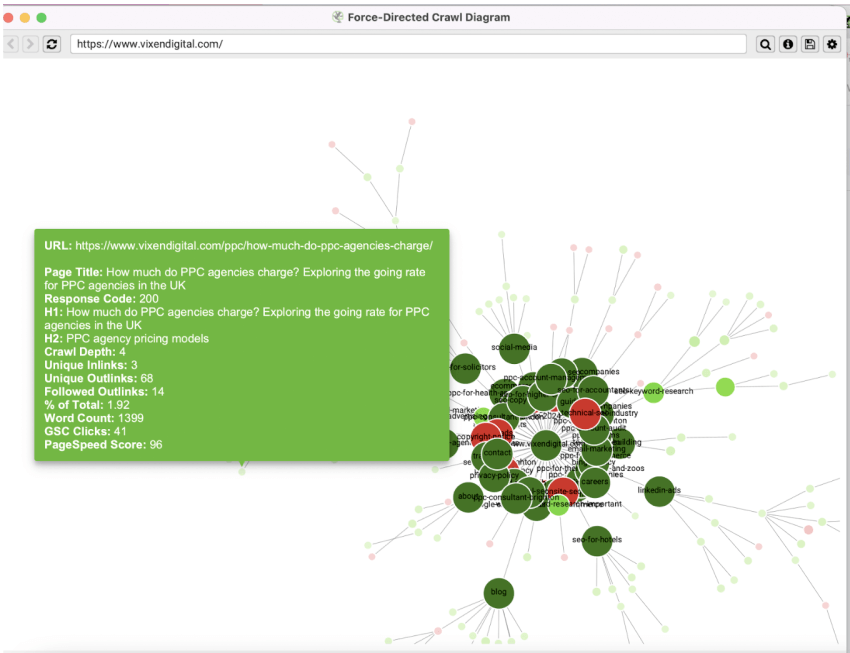
There is no magic number of Inlinks you should add to a page. Excessive and unnatural linking can hurt user experience. Plus, your link position also plays a role. What this analysis immediately tells me is that a commercially relevant page has only three links which is low.
It is obvious why this has happened. This blog is an older one that has simply been forgotten about. It still carries some rankings but since then we have written several other pieces from which we could link to it but simply forgot to do so.
Exploring Pages With Force-Directed Crawl Diagrams Scaled With Ahref URL Rating
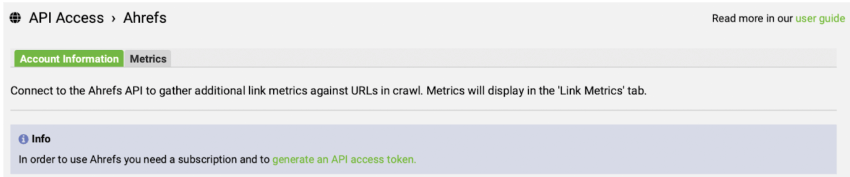
For this analysis you will need to connect your Ahref account to Screaming Frog using the API. It is super simple though! All you need is to generate an API key and Screaming Frog will provide you with a direct link to do this in their Crawl Configuration settings.
Once this is done, just make sure you click on Metrics and choose the ones you will need. In this case, you will need the URL (Exact URL http + https) but I like to choose all metrics since they can be used in other Ahref analyses eg. Link Metrics tab.
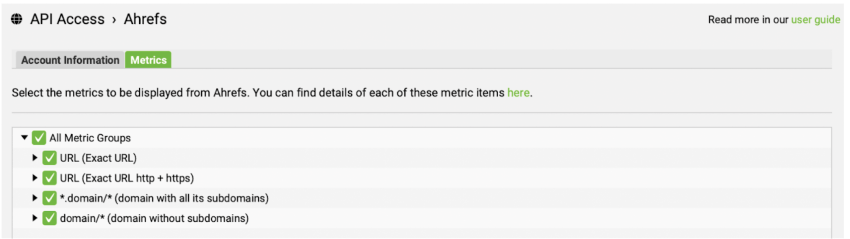
Once these two tasks are complete you can run your Force-Directed Crawl Diagram scaled with Ahrefs URL Rating. URL Rating (UR) shows the strength of a page’s link profile on a 100-point scale. The bigger the number, the stronger a page’s link profile is.
As a small website that relies on organic link building and has only recently really started publishing more content, Vixen Digital doesn’t have many authority pages in terms of UR. So for us using Force-Directed Crawl Diagrams in this way was a nice overview of which of our blogs are getting natural links. Our home page is obviously the winner here which is to be expected. But it was great some of our blogs are starting to earn links.
Checking Page Speed at a Glance
Ever since Google introduced the Core Website Vitals (CWV) metrics back in 2020 and made them a ranking signal, the SEO community has been debating them. We won’t go into it here but in general in our experience: yes they are important but need to be measured against other SEO tasks. Let’s face it, even some of the biggest brands don’t have a perfect “green performance score”! A better way of understanding Core Website Vitals, and in fact anything to do with Google, is by looking at the impact on the user experience.
A quick intro to the basics. Core Web Vitals measure:
- Loading performance using a metric called Largest Contentful Paint (LCP),
- Interactivity using First Input Delay (FID) – this will soon be replaced with a new metric Interaction to Next Paint as a more accurate measurement
- Visual stability using Cumulative Layout Shift (CLS)
Another space of confusion between how they are measured which brings into question what they are. You can measure these same metrics in two ways:
- Lab test – If you want to see how your website performs under stressors (eg. bad connection, no cache…) using this type of analysis is good. Google Lighthouse shows your lab data. Out of the box, this tool gives you lab data – so data where the environment is controlled and usually a ‘stressed one’. It most often measures a new user with no cache (cold load). That’s why devs use it for troubleshooting deployment.
- Field test – This data is taken from the Chrome User Experience Report and it shows you the aggregate data of real usage of your site. How real users are using your website. This is the data in your Search Console and PageSpeed Insights.
Both Force-Directed Diagrams and the 3D Force-Directed Diagrams can be scaled using Page Speed Score which is brought in via PageSpeedInsights API. As is the case with bringing in Ahref data in the previous application example, you will need an API key which again is super simple to do and Screaming Frog will give you a direct link in their Configuration – API settings.
Note: To differentiate between desktop and mobile results, PSI API uses the strategy parameter. The default is desktop. This means that by default you will see desktop CWV metrics in Screaming Frog as well.
Using 3D Force-Directed Crawl Diagrams for a Bird’s Eye View of Your Website Page Speed
By connecting your Screaming Frog to PageSpeed API you can easily scale 3D Force-Directed Crawl Diagrams One of our clients that is currently in the process of migration and by having a bird’s eye view of the website in terms of speed we can already see that a deeper look into that element of technical SEO is needed to ensure the new website has better CWV.
Even their Home page needs improving and some key pages have slow scores. The next step for us is to review all important pages deeper and understand what is causing these scores. This way the new website can be launched without these issues.
Final Thoughts
I’ve never met an SEO who doesn’t love a pretty visualisation tool. And the Screaming Frog ones are certainly visually stunning (unless you are trying to use them on a large website in which case I’d urge you to reconsider!)
But what I love about them is that they are pretty AND useful. They won’t give you all the insights in one go and often you will need to dig deeper. But they are a useful and appealing way to start discussions, speak curiosity and gain some valuable initial insights. These examples of practical applications are here to inspire SEOs, particularly those who are visual learners, to give them a try!


0 Comments